Our annual RaceTrends Report is here, breaking down the participation numbers and industry trends from 2023 to help you make better predictions and more successful decisions in 2024. The headline from this year’s report is that race participation in 2023 was down just 1% compared to 2019, suggesting it’s time to refocus attention on growth.
For all the numbers, dive into the full 2023 RaceTrends Report or sign up for our upcoming webinar!
Key Takeaways from the 2023 RaceTrends Report
We’ll take a closer look at some of the key stats over the next few months to break down what the data says – and what we recommend for your race. In the meantime, a few of our favorite takeaways from 2023:
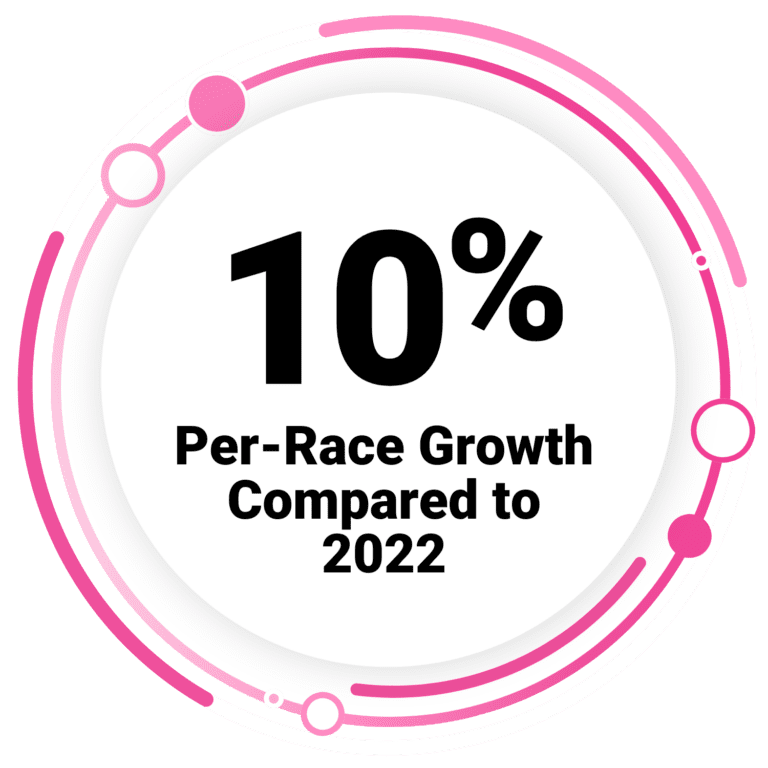
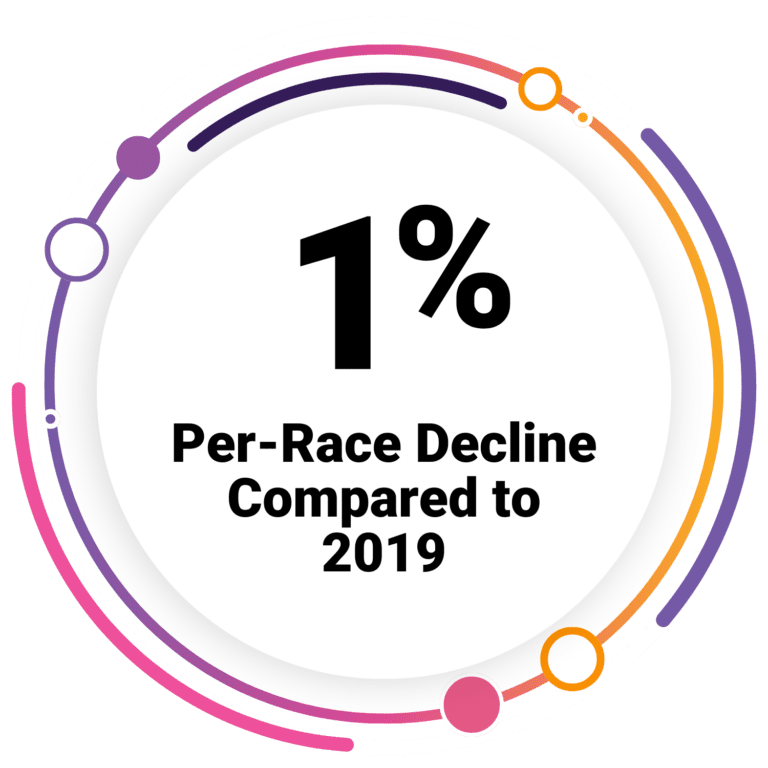
- Per-race participation is back to it’s pre-pandemic baseline. Participation increased 10% compared to 2022, and declined just 1% compared to 2019.
- Large races still face challenges. While races with fewer than 500 participants grew an average of 14% compared to 2019, races with more than 5,000 participants were down an average of 16%.
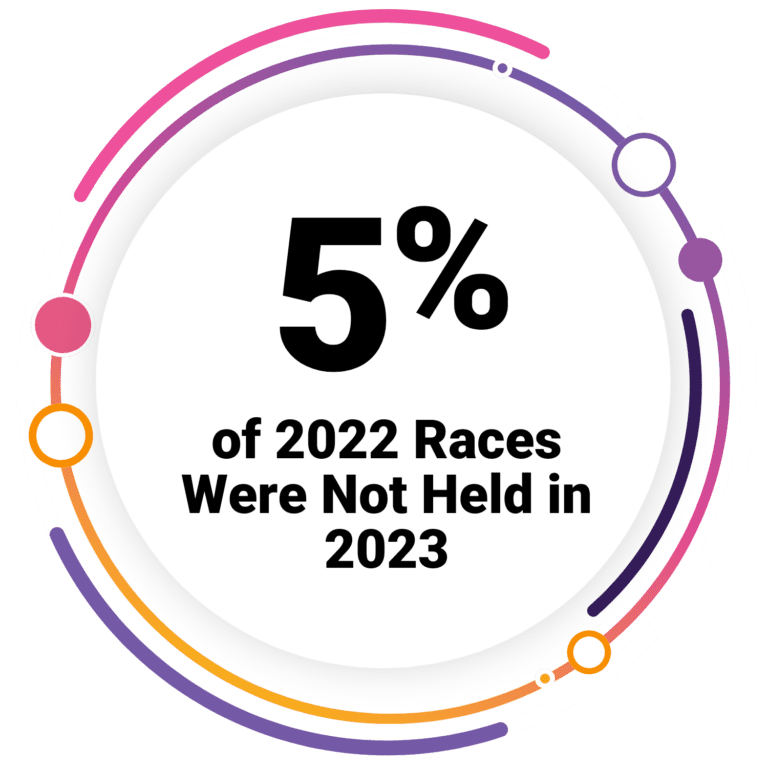
- Race Churn has stabilized 5% of 2022 races (with more than 500 participants) did not take place in 2023, similar to pre-pandemic churn rates
- Participants seek variety. Just 16% of participants from 2022 repeated the same event in 2023, with half marathons seeing only 13% of participants repeat
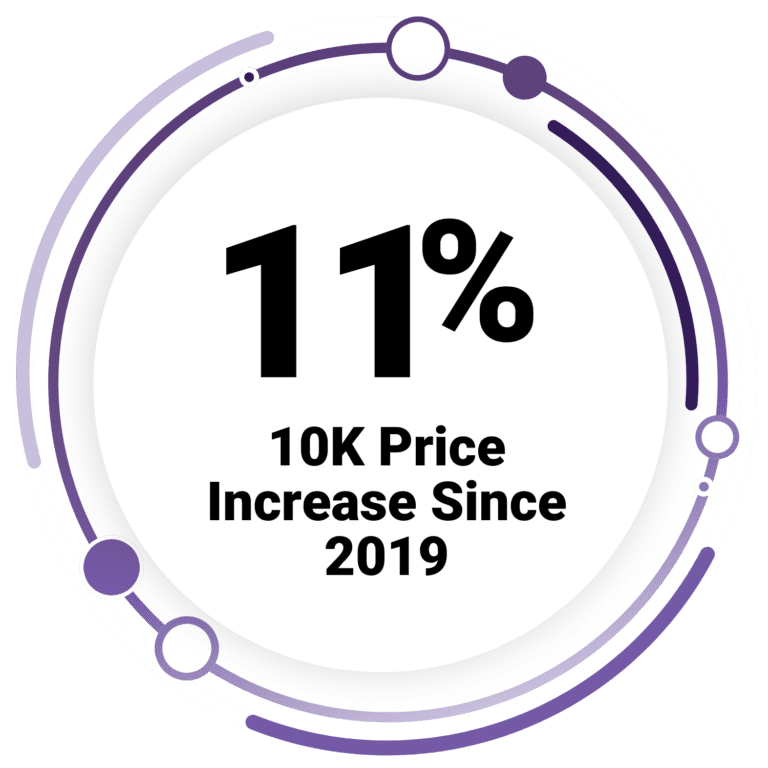
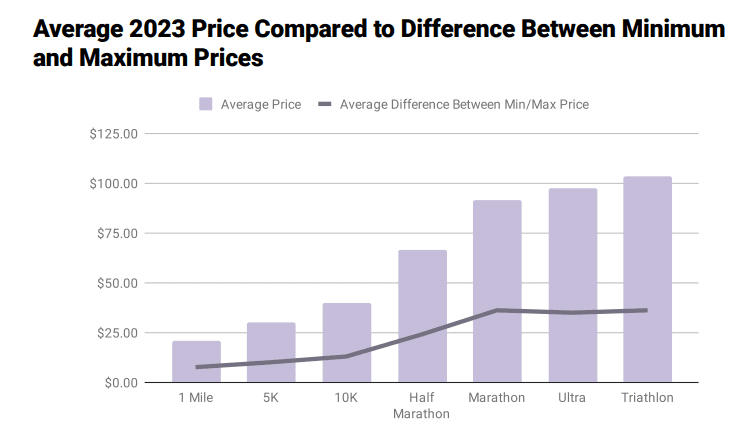
- Prices continue to rise. Prices increased across all race distances, with the average 10K price set 11% higher than in 2019 and 4% higher than in 2022
- Women race more than men. Females still make up the majority of participants but the gap is narrowing, with 53% of participants identifying as female
- Young adults may be returning. There is cautious optimism about young runners, with the 15% of registrants between 18-29 – the highest participation by young adults since 2019
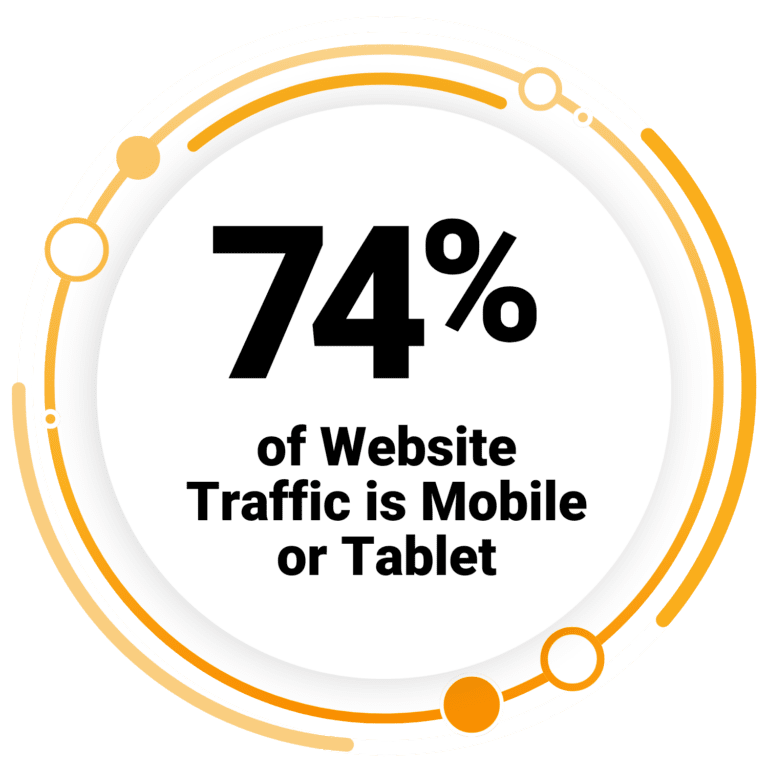
- Mobile dominates. 74% of race website views and 60% of transactions coming from mobile or tablet devices
- Easy payments are important. 31% of participants paid with Apple Pay or a Saved Credit Card.
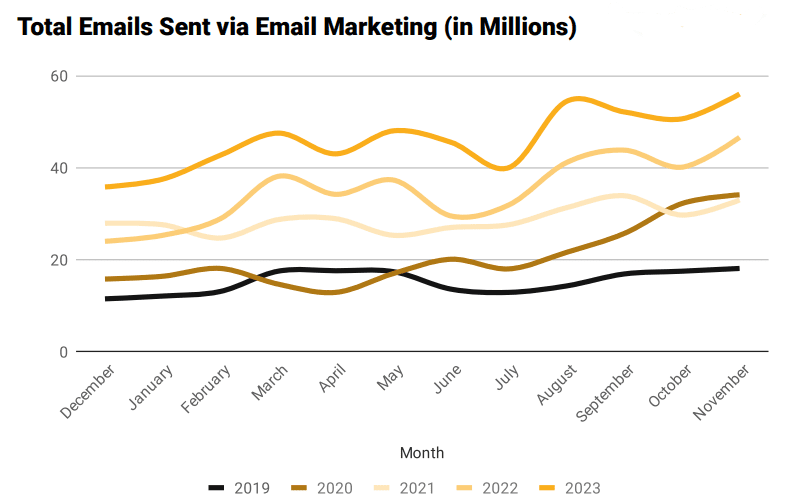
- Email prompts registrations. Races sent 553 million emails on the RunSignup platform in 2023. 17% of all transactions came from RunSignup emails.
- Teams are consistently beloved. 31% of participants join a group/team when it’s offered – consistent with the level of social enthusiasm we’ve seen each of the last 5 years
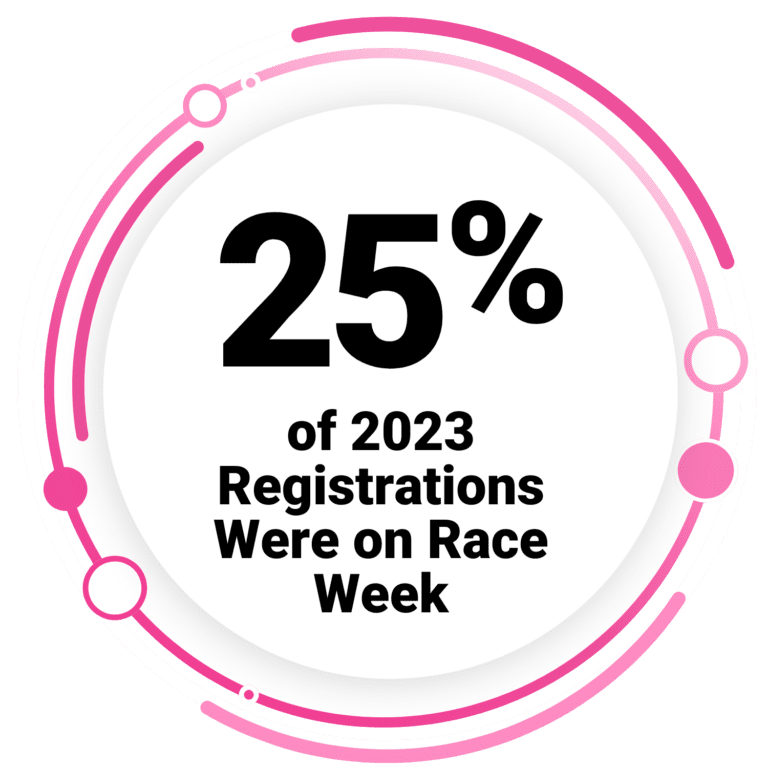
- Procrastination is steady. 25% of all registrations came on race week, consistent with race week registrations throughout the last 5 years
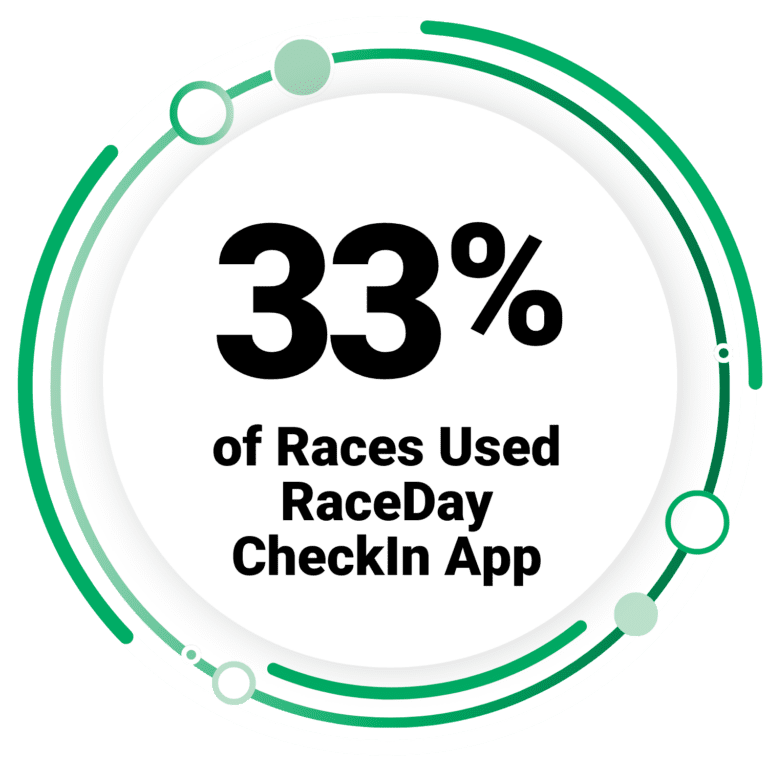
- RaceDay CheckIn gains popularity. The RaceDay CheckIn App saw record usage in 2023, with 33% of races using the app to check-in 39% of participants.


About the RaceTrends Report
The report was built by mining RunSignup’s registration and finisher data covering a five-year period to generate transparent statistics, identify trends in the industry, and provide recommendations to boost endurance event participation. It is estimated that the data on RunSignup accounts for 40% of the US endurance market. The data in RunSignup’s 2023 RaceTrends report includes more than 75,000 race events and 9.3 million registrations.