The year-over-year Transaction insights graph on your dashboard has a new update. Rather than displaying YoY transactions by calendar year, it now uses registration periods to display YoY reporting that is relevant and actionable for events.
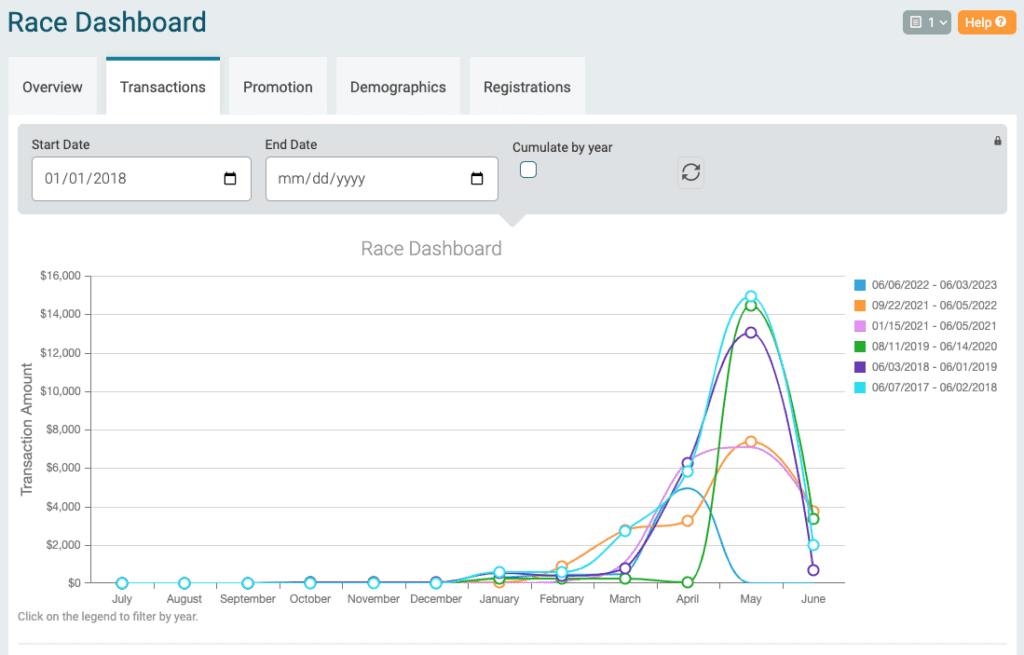
You can update the chart to drill into a set of years by clicking years to filter the chart.
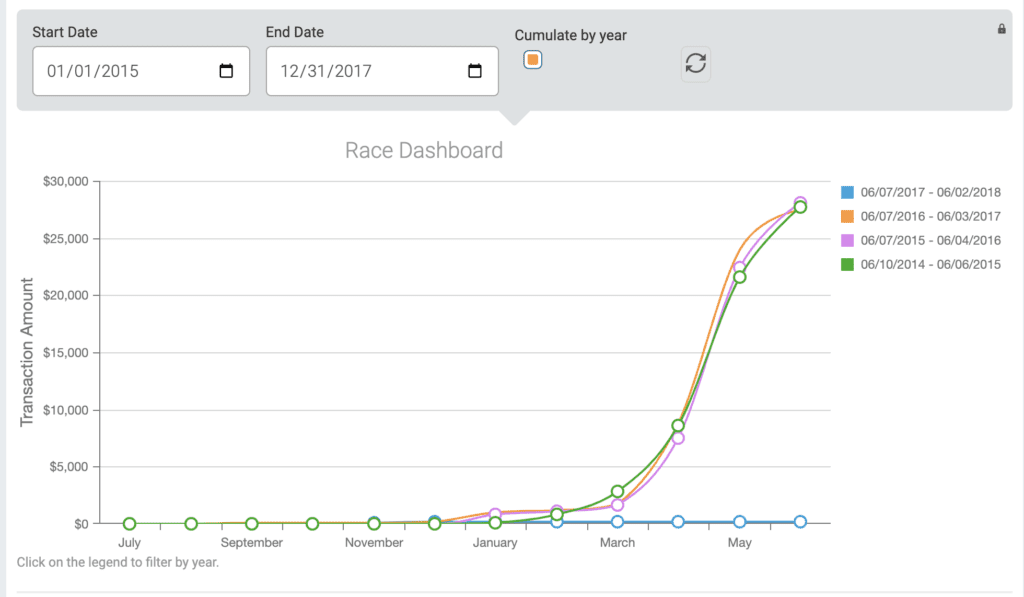
You can also filter based on a date range at the top of the chart. The setting to “Cumulate by Year” will show the overall transaction growth by month rather than the total per month. Click the arrows to refresh the view once you have entered a date range and/or checked “Cumulate by year”.