Thanks to everyone who joined us for Part 1 of our Marketing Analytics Webinar Series focused on RaceInsights reporting. If you missed the webinar live, it’s not too late to catch up with the on-demand version. You can also find links to each of the specific sections covered below.
RaceInsights Resources
If you just need a quick refresher to find some of the reports referenced, review materials can be found below.
Dashboard Summary Stats
Jump to Dashboard Summary Stats in Webinar
If you just need a quick, 10-second glance at how your race is doing relative and how that relates to the previous 2 years, your dashboard summary stats are the place to go. To access them, just click the down arrow next to “Signups” at the top right of your dashboard:

This will show you a quick snapshot of your registrations this year compared to the previous year. To see details by event, click the down arrow next to “Total Registrations”.

RaceInsights
Jump to RaceInsights in Webinar
Your main RaceInsights graph shows on your race dashboard automatically, showing the patterns of views, registrations, and more. You can customize this in two ways:
- Click the down arrow where it defaults to “last 7 days” to view a specific date range or customize your range (up to 90 days).
- Click the “edit” icon to the top right of the chart to customize which stats show on the chart. Pageviews, signups, transaction $, signup $, and donation $ are all options.
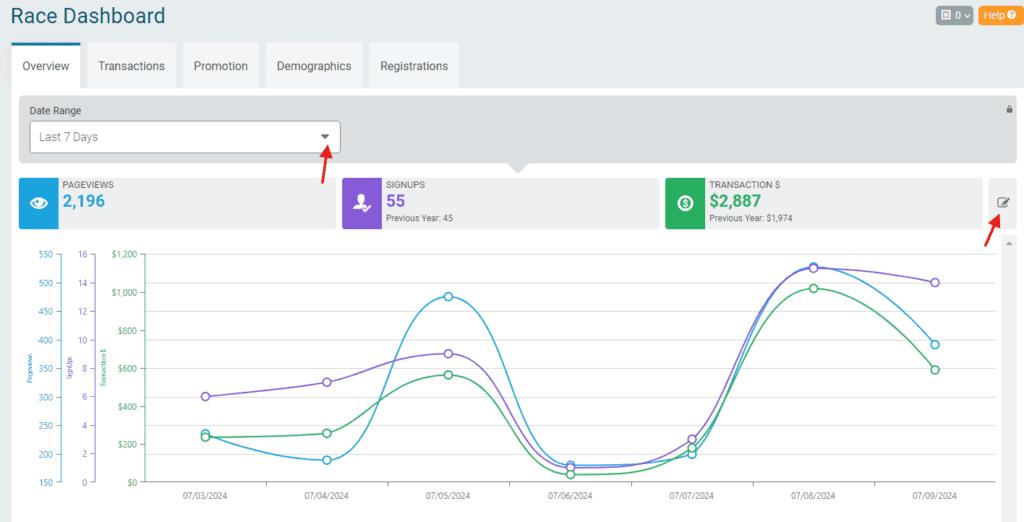
At the bottom of your RaceInsights chart, you will find a table showing the sources of all actions and payments on your page. You can click into the source types for more detail:
- Referral sources will show you the exact source, such as Google and/or an affiliate like RunningInTheUSA.com.
- Email will show you the exact RunSignup email that led to actions.
- Custom will show you your custom tracked links. We’ll cover this next.


Custom Source Tracking
Jump to Custom Source Tracking in Webinar
While referral sources and emails are automatically tracked by the system, you can dive in deeper with Custom Source Tracking. This lets your track the results of a specific marketing action through a unique link. Example use cases for a Custom Source Tracking Link include:
- Ads (Facebook/digital)
- Print materials (use a QR code of the custom link)
- In a emails from non-RunSignup platforms
- With partners or ambassadors
To create your custom tracking link:
Navigate to: Promotion >> Source Tracking >> Source Tracking Codes (or use the search bar to search for source!).
Click the button to add a code:

Add a description that you’ll understand and any known costs.

Back on the Source Tracking Codes page, your newly created link will show, along with any pageviews and signups from that link. To get the shareable link (and a QR code you can use on print materials), click the link icon next to the source.


More Reports on Your Dashboard
Your Dashboard defaults to the “Overview” reports, but there are tons of great reports under the additional tabs as well! Take a quick look at what you can find under each tab.

Transactions
Jump to Transactions Reports in Webinar
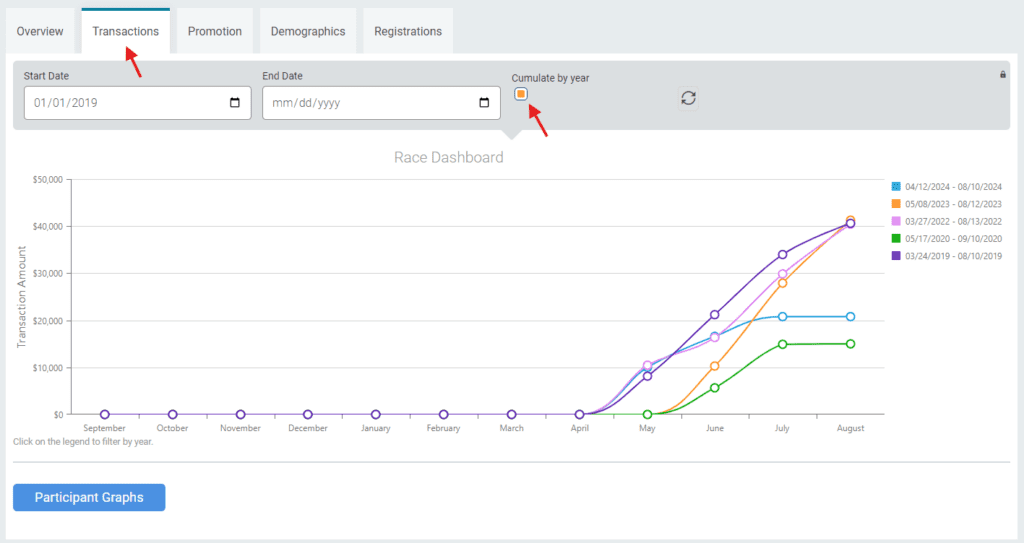
This report gives you a snapshot of your year-over-year transactions. There are two views – the one below that shows total transactions for the year is accessed by clicking the “Cumulate by year” box and hitting the refresh icon.
Promotion
Jump to Promotion Reports in Webinar
The promotion tab has a number of quick-look marketing reports. One of our favorites is the Loyalty report showing how many of your participants have returned each year:
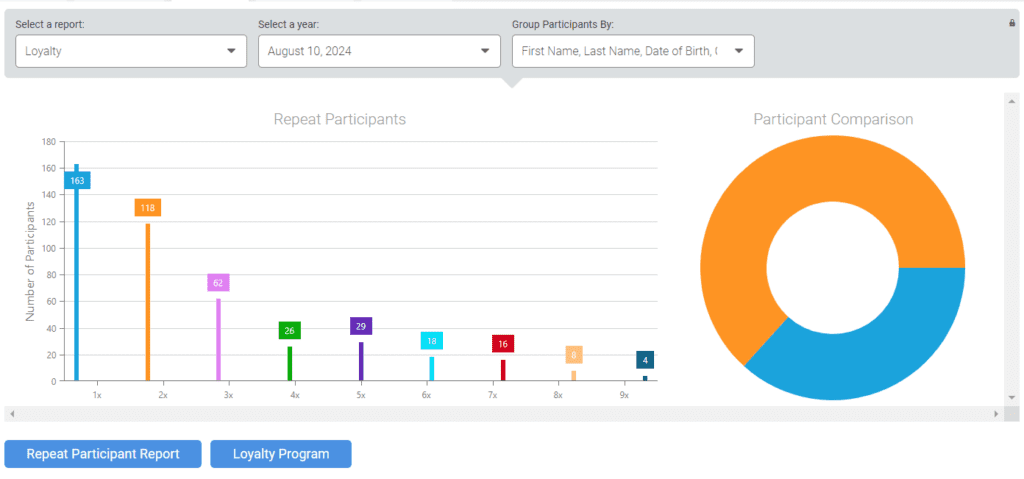
For more actionable information, click on the “Repeat Participant” report button at the bottom. This will give you a person-by-person report of every runner and how many times they have registered for your race. Scroll to the bottom of the list to download the report for further analysis.
Demographics
Jump to Demographics Reports in Webinar
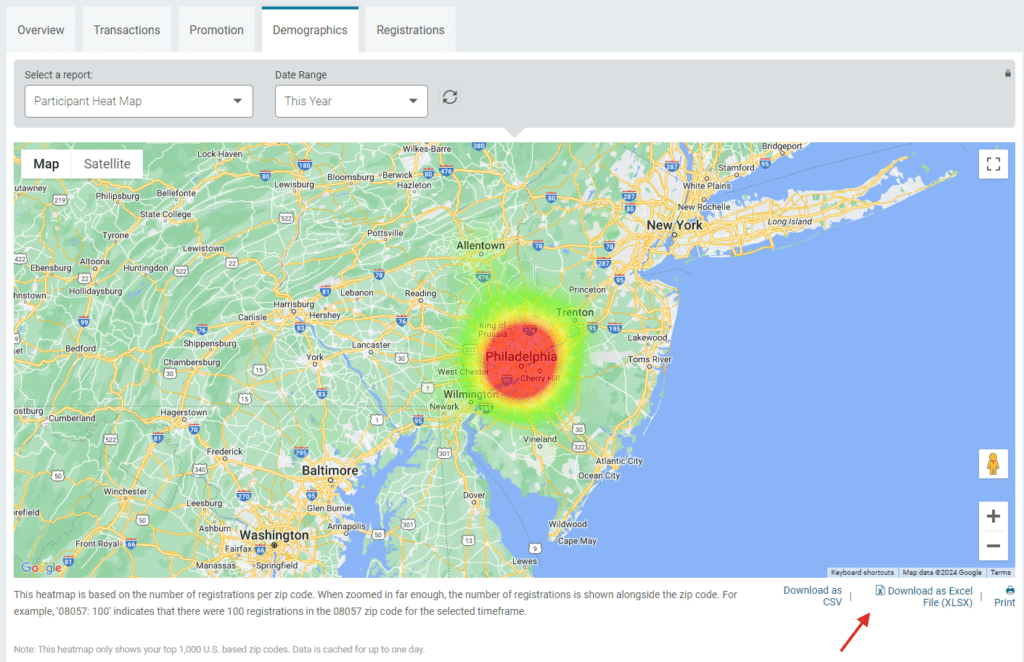
One of our favorite demographic reports is the Heat Map. On a glance, it’ll show you whereabouts your participants come from. Most importantly, you can also export the actual zip code data (from the bottom right of this map). That location data can be used to target strong areas for promotion and community-building.
Registrations
Jump to Registrations Reports in Webinar
We highlighted a few reports under the “Registrations” tab. These included:
- Registration Periods. While this can look overwhelming on first glance, you can use it to determine if there is room in your registration timeline to add additional price increases. To make it easier to understand the registration patterns, there is an option to download the raw data at the bottom of the chart.
- Revenue by Event. This report give an easy way to see how much of your revenue comes from each event (like 5K or 10K). This allows you to make smarter decisions about which events to continue.
- Day and Time of Sign Ups: While these reports will be impacted by actions you take (the day of the week you opened registration or the time you usually send emails), they can give some guidance about registrant behavior. Peak days and times for registration can be ideal for sending emails!
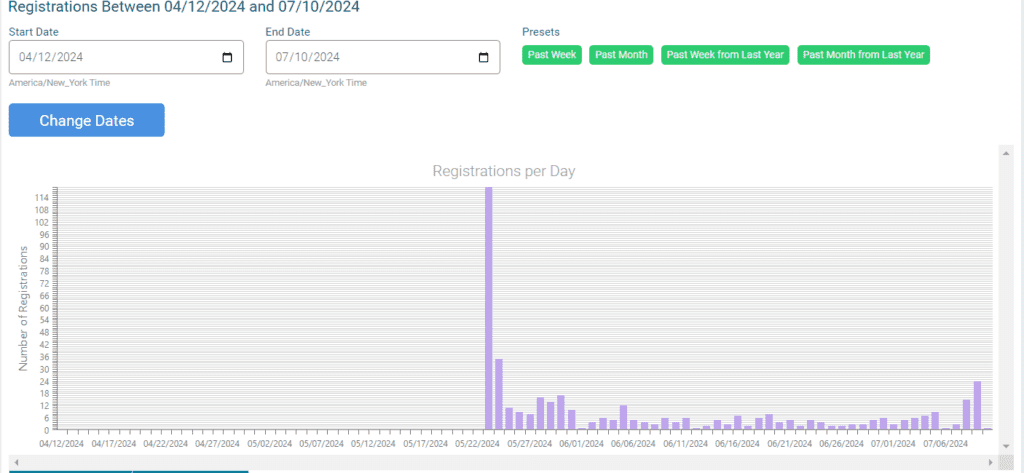
- Registrations per Day. Better understand the nuances of your registration patterns with registration totals by day (downloadable!).
Full RaceInsights Webinar:
