Event Information
WHEN
ON DEMAND
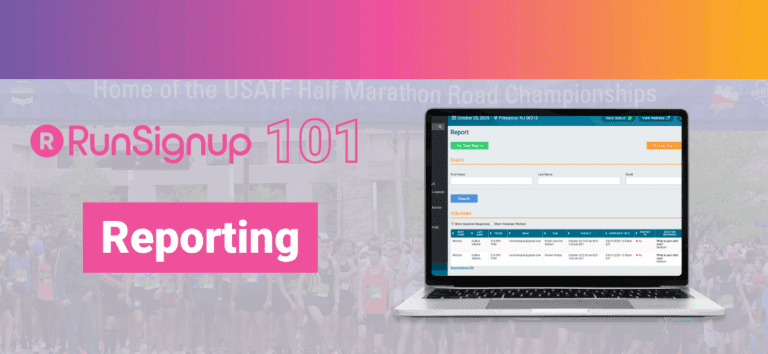
New to RunSignup or just need a refresher on reporting? Join us for a beginner-friendly walkthrough of the Reporting tools available in your dashboard. This session will show you how to find, filter, and understand your data—so you can make informed decisions for your race or organization.
We’ll cover:
Where to find reports in your dashboard
Key registration and financial reports
How to filter and export your data
Tips for customizing reports to fit your needs
Live Q&A
Perfect for race directors, nonprofit admins, or anyone looking to get more comfortable with RunSignup reporting!
Summary of Webinar
1. Getting to Your Race Dashboard
Before reports, Whitney walks through basic navigation.
Logging in & finding your race
Go to runsignup.com and log in.
You can access your race dashboard in a few ways:
Option A: My Races via profile icon
Click your profile icon/photo in the top-right.
Choose “My Races” from the dropdown.
Click your race → Race Dashboard.
Option B: Via full Profile
Click profile icon → “Profile”.
Scroll down to “Race Director” section at the bottom.
Click your events from there.
Option C: From the race website
Go to your race website.
Click your profile icon on the race site.
Select “Race Dashboard”.
Dashboard basics
Left-hand side = all your tools/features.
There’s a “Show More” link:
Some features (like Volunteers, etc.) are hidden until you click Show More.
If you can’t find a feature, check Show More first.
Two built-in search tools
Top-right search box (Participants search):
Quick lookup by name, email, etc.
Example: Joe Smith emails you and is upset; type “Joe Smith”, pull up his registration immediately.
Left menu “Menu Search” (feature search):
Search for features/pages, not people.
Example: Type “QR” → jumps directly to QR code page instead of hunting through menu.
Whitney calls this one of the best tools on the platform given how many features exist.
2. Why Your Data (and Reporting) Matters
Whitney pauses before diving into specific reports to talk about why they matter:
Understand your participants
Demographics, locations, behaviors.
Helps you market to the right audience and grow your race.
Lets you “level up” the participant experience based on what people actually do/want.
Understand your finances
Know where you stand with revenue, fees, refunds, transfers, etc.
Accurate reconciliation for accounting and stakeholders.
Save time over time
Custom, saved reports → you’re not rebuilding the same exports every week.
Repeatable workflows: monitor registrations, financials, and marketing performance on a schedule.
Big picture: you own this data; RunSignup gives you a lot of tools to actually use it.
3. Core Reports: Participants & Registration
Under Reports → Participants / Registration you’ll find the workhorse tools you’ll use most often.
A. Participant / Registration Reports
Main place to:
Search for participants
Filter & sort using many fields (name, email, DOB, etc.)
Export registration data
Build custom reports
Reports are interactive, not just “export and use Excel”:
You can click into a person, edit, manage, and act right from the report.
B. Participant Detail View
Clicking a participant gives you a detail page:
See all of their registration data.
Actions like:
Edit registration fields
Manage their entry (change event, transfers, etc.)
View their profile
Top of the page typically includes:
Search
Change Event
Report options (custom views)
(Participant management itself isn’t the focus of this webinar, but it’s all linked from these reports.)
C. Custom Participant Reports (and saving them)
From the participant listing, you can:
Choose exactly which columns/fields to include.
Example: First Name, Last Name, DOB, Bib.
You can save these configurations as named custom reports:
Then reuse them anytime under Saved Reports.
Live, real-time data whenever you run them again.
Tons of fields available (you can get very granular if you want).
D. Waiver Agreement Report
Waivers are critical (legal protection, event policy compliance).
There’s a dedicated Waiver Agreement report:
Shows who has signed the waiver.
Search within the waiver list.
Export as needed (e.g., for legal/recordkeeping).
Can be found via:
Reports → Participants → Waiver Agreement, or
Menu search: type “waiver agreement”.
E. Registration Summary Report
Good for a quick snapshot:
How many people are registered?
How does that compare to last year?
Quick look at demographics (charts, tables).
Breakdown per event.
Useful when:
Ordering shirts.
Checking trends at a glance.
Giving quick updates to your board/sponsor.
4. Giveaways, Add-Ons, and Group/Team Reports
A. Giveaways vs Add-ons
Whitney emphasizes the difference:
Giveaways = Included with registration
Example: T-shirt, mug, pint glass.
Typically part of the “base” registration fee.
Add-ons = Extra-cost items
Example: Sweatshirts, extra shirts, beer tickets, meal tickets, premium swag.
Participants pay additional fee for these.
Giveaway & Add-on Reporting:
See:
Total counts per item.
Breakdown by size for T-shirts.
Revenue generated by add-ons.
Essential for:
Ordering correct quantities.
Understanding which upsell items are performing.
B. Group/Team Reporting
Especially important for:
Family-friendly races with groups.
Corporate teams.
Challenge events and team-based fundraising structures.
Reports allow you to:
See number of teams.
View team captains and members.
Drill down:
All participants on each team.
Or stay high-level with team counts.
This ties well into both participation structure and fundraising (if used).
5. Optional Features & Their Reports
These are not required, but very commonly used:
Donations & Fundraising
Referral Marketing
Coupons / Discount Codes
Whitney gives a quick overview of the reporting for each.
A. Referral Marketing Reports
Referral program can be turned on during race setup (Race Wizard).
Default example:
Get 5 people to register using your unique referral link → receive a $20 refund.
You can adjust:
Number of referrals required.
Refund amount or other reward.
Reports let you see:
Who referred whom.
How many referrals each participant has.
Who has hit their referral threshold and received a refund.
Total refunded via referral program.
Point: You’re effectively trading one registration refund for multiple new registrations—net positive for the race.
B. Donations & Fundraising Reports
Whitney is (admittedly) biased, but highlights this as one of the strongest areas of the platform.
Reports support:
Total donations to the event.
Breakdown by:
Timeframe.
Fundraiser / team / campaign.
Can drill down from:
A fundraising campaign → fundraiser → individual donors/participants.
Lots of configuration and detail:
Helpful for charities, peer-to-peer fundraising events, walks, etc.
Detailed deep dives exist in other webinars/YouTube/tutorials.
C. Coupons / Discount Codes
Called Coupons (but same idea as discount codes).
Reporting shows:
List of all codes.
When each expires.
When they were created.
Usage count (how many times used / remaining uses).
Everything is real-time:
If someone used a code two minutes ago, the report reflects it immediately.
Useful for:
Tracking promotions.
Evaluating partner/sponsor performance.
Avoiding overuse of limited codes.
6. Financial Reporting
Whitney ends on financials—probably the second-most important area after participants.
Two key reports to know:
A. Financial Summary Report
Location: Financials → Summary
Provides a high-level overview of your race finances:
Gross vs. net revenue.
Processing fees.
Fee adjustments:
Refunds
Transfers
Deferrals
Etc.
You can view:
Summary by race, or
Drill into more detailed views.
Hyperlinks on the page:
Under items like Transactions, Refunds, Holdbacks, etc.
Clicking them takes you to:
Either an interactive detailed report, or
Directly to a CSV/Excel export.
Critical tip:
Use the orange Help button in the top-right of the page.
Present on every page, but especially valuable here.
Takes you to a tailored tutorial for that exact page.
Explains every section line-by-line.
Often includes videos and screenshots.
If the financial summary page feels overwhelming, the Help tutorial is your friend.
B. Payout Report
This is your big financial deep-dive hub.
From the Payout report, you can:
See:
How many payments you’ve received.
What funds are still being held.
How much has already been paid out.
Access detailed data for:
Donations
Store/add-on purchases
Team-related payments
And other financial subcategories.
Like the summary:
Many links go to:
Interactive pages you can filter; or
Direct Excel exports ready for accounting software like QuickBooks.
Rule of thumb:
Want a quick financial picture? → Use Financial Summary.
Want granular detail and all export options? → Use Payout Report.
7. Key Takeaways
Whitney’s main closing points:
Your data matters.
It helps you:
Market better.
Reach the right people with the right message.
Improve participant experience.
Make better decisions year-over-year.
Time in the platform = confidence.
The more you click around and experiment:
The less overwhelming it feels.
The easier it is to choose the right report for your goals.
Know your goal first.
Figure out:
“What do I want to know?”
“What am I going to do with this information?”
Then choose / build the report that gives that answer.
You own this data—and can access it anytime.
Don’t let it just sit there.
Export, analyze, use it in your planning & marketing.
You’re not alone.
Use:
Your Account Manager for more advanced guidance.
The orange Help button on each page.
RunSignup YouTube, blogs, & tutorials for deeper dives into specific reports (especially Donations/Fundraising, Financials, etc.).