
The Spring Lake 5 Mile run opened on Super Bowl Sunday at 5AM as they have for many years. This is always an interesting race opening to watch as it is large (12,500 in the 5 mile plus more in the Kids run), it has sold out in years past, and we like to watch how our infrastructure handles the burst. There were several pieces of good news:
Back to Sell Out
It is encouraging to see a large race back to being a sell out at normal capacity. This continues positive trends we have seen about getting back to 2019 levels for the overall community.
21% Used their Saved Credit Cards
One of the nice features of RunSignup is we make registration very fast for participants that use us for multiple races. This includes remembering normal things like address, but also information like emergency contact, shirt size, family members and saving credit card (optional). On Sunday we saw just over 21% of registrations happening with saved credit cards.
Fast Checkout
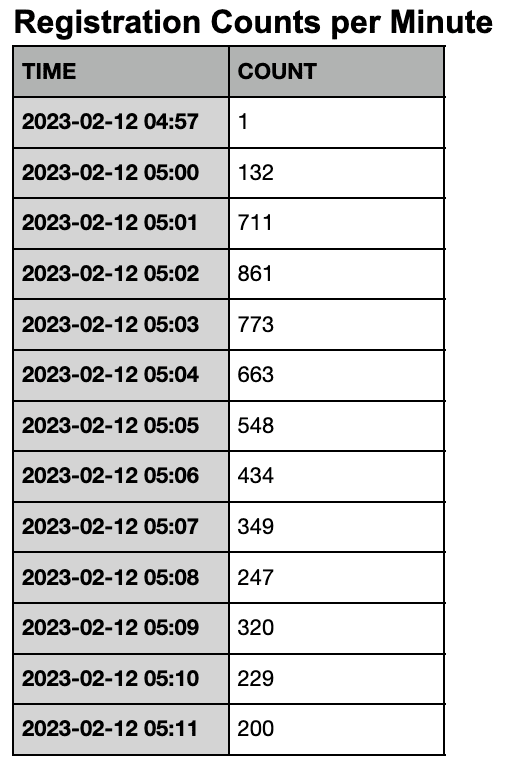
132 people registered in under 60 second. Over 1,700 registrations within 3 minutes (at 5:00AM). Here are the stats:
Our Infrastructure Handled the Load Well
We handled this with the normal infrastructure we run, which is designed to handle over 2,000 registrations per minute. With this opening we saw a peak usage of any one resource being just a bit over 20% and average use per minute of around 15%. Below are all the fun graphs and stats…
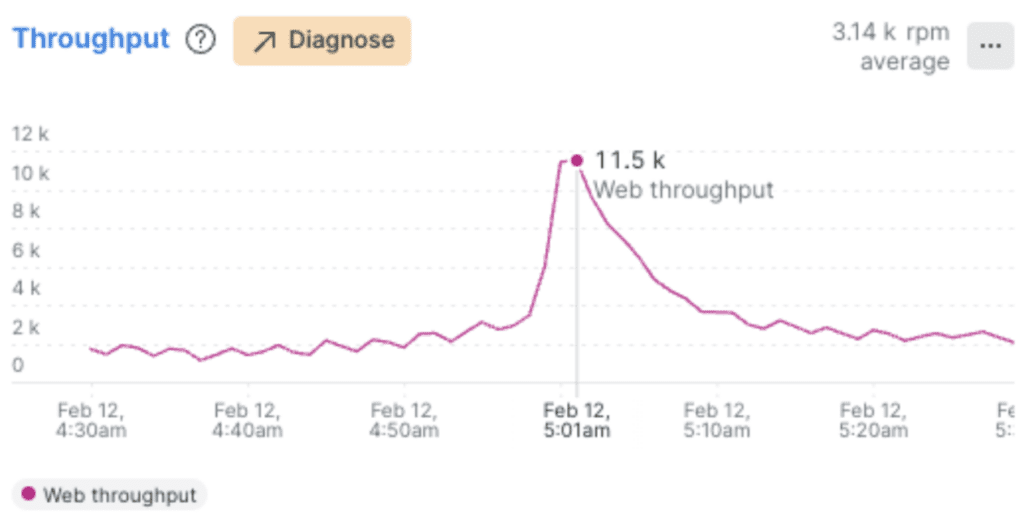
Peak pages per minute was over 11,000 (this is below the 24,000 pages per minute we saw on Thanksgiving as people checked results and photos):
One of the fun stats is that the actual time to process the average request in our system actually goes down because most of the load is coming from a single event, which allows for a lot of things to be cached. The fastest response was the heaviest traffic at 45 milliseconds. That is 0.045 seconds:

We use two key external services – one for processing the transaction in the credit card network (Adyen) and the other to calculate sales tax (Avalara) on each transaction. As you can see in this graph, those slowed the total response time down to a max of 225 milliseconds (0.225 seconds). This is a bit misleading as it is really just the mix of page requests with a transaction associated with it, and would not really increase under much heavier load:

Our Load Balancing tier with 4 servers (which also includes a lot of security functionality) used the most of any tier at an average of 18% (with an instantaneous peak of 24%):
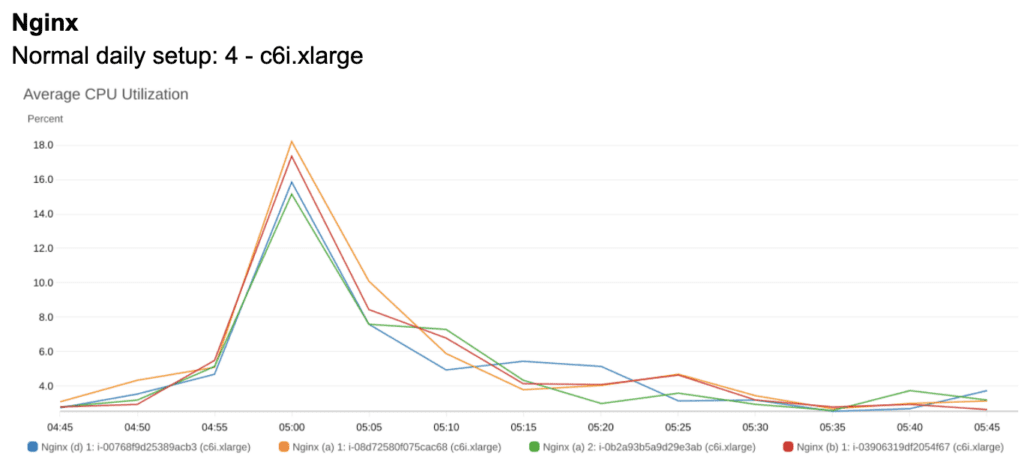
Our Webserver tier with 4 servers also handled the load well with a peak average of about 14%, and an instantaneous peak of a bit over 20%:

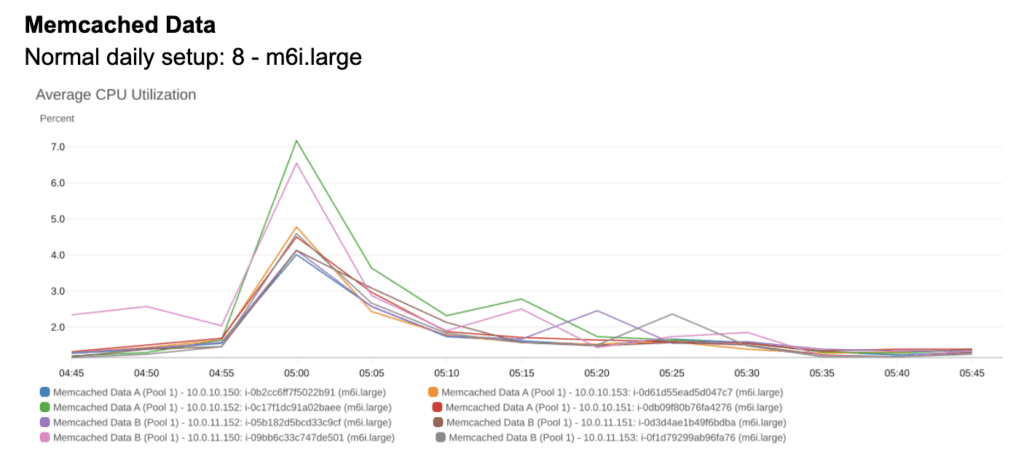
Our Caching tier is made up of two redundant sets of servers (total of 8 servers). One set is for session data and the other is for read data. Caching allows faster read access and saves cycles on the database had a lot of room for scaling with an average max of just 7% and a instantaneous max of 12%:
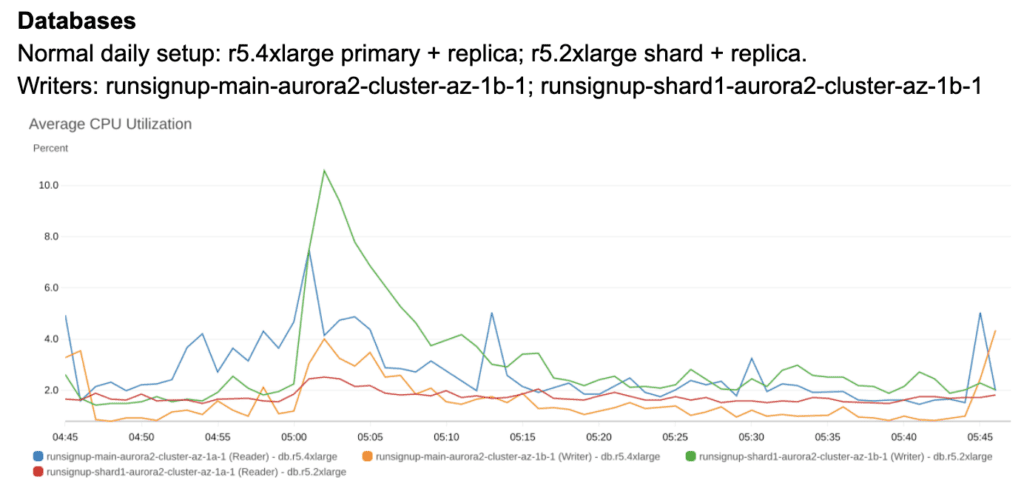
Finally, the database tier is fairly complex with a Main Database and a Database Shard (the key database tables are in the main and the less critical tables are in the shard, which allows for long term scaling of our database). We also run read replicas of each, again for scaling. Average and Max were both a peak of 10% on the Shard Writer.
Summary
There is nothing like the real world test of a large race opening. We keep stats on all of them and compare them over the years to make sure we continue to improve. We made a number of adjustments from the Thanksgiving peak of 24,000 pages per minute and are very happy with the results. We are ready for continued growth and the largest customer needs.