We release an annual RaceTrends Report each winter to provide a thorough assessment of the state of the endurance and fundraising events industry. Today, we have a brief update looking at 2025 midyear race trends to help event organizers better understand the current state of the industry.
The Data
The data used for this report includes internal RunSignup data from 12/1/2024-5/31/2025. Data from the 2024 RaceTrends Report covered 12/1/2023-11/30/2024. The numbers represent 4.8 million registrants (paid and imported) from the first half of 2024. We estimate that our data represents around 50% of the endurance market.
Races Are Growing (a Little)
A key metrics to determine the strength of the market is to compare the number of participants in races that have used RunSignup for two years. This removes any impact from increased market share or new races in the market, looking only at how participation numbers have grown on a per-race basis.
Per-Race Participation Growth 2024-2025
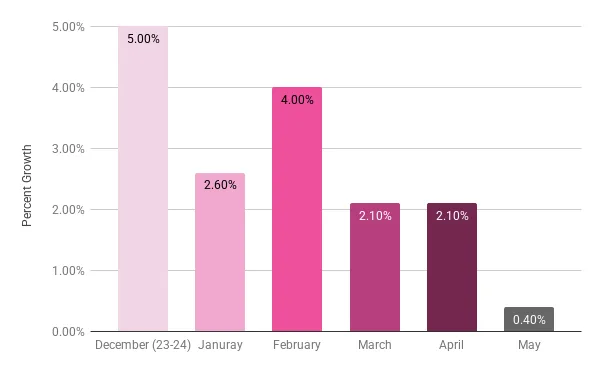
While growth has slowed compared to the 8% growth seen from 2023-2024, races are still seeing a slight uptick in participation. This is especially encouraging considering that the average race in 2024 exceeded participation levels.
Additionally, per-race revenue growth in the first half of 2025 exceeded participation growth. On average, races saw a 7% increase in revenue from 2024-2025. This suggests that price increases and alternative revenue sources (like add-ons) are boosting total race revenue.
Large Races are Still Growing
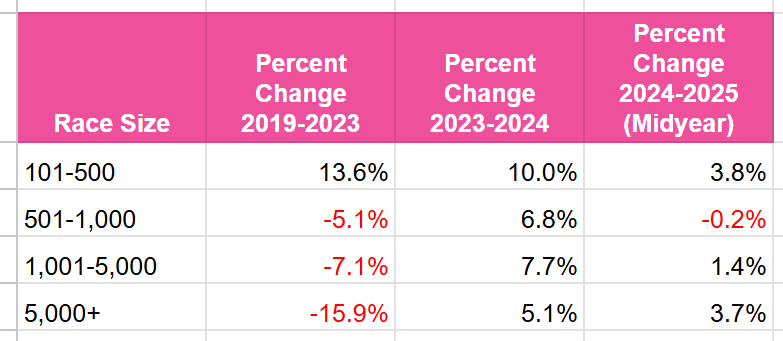
Large events (5,000+ participants) were the slowest to rebound from the pandemic participation lags. While growth for large races is still slow and steady, they continued to re-grow participation even as races from 500-5,000 participants stayed relatively stagnant.
Per-Race Growth by Race Size
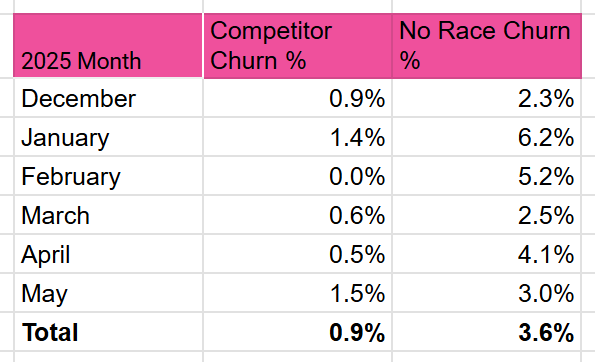
Low Race Churn
We manually track every race over 500 participants to see how many of them return on our platform, how many leave for another platform, and how many events cease to exist at all. So far in 2025, just 3.6% of races that had more than 500 participants in 2024 did not return in 2025. That’s the lowest no-race churn we’ve seen since we started tracking churn in 2018, suggesting a very stable market.
Churn Rate in the First Half of 2025
Key Takeaways:
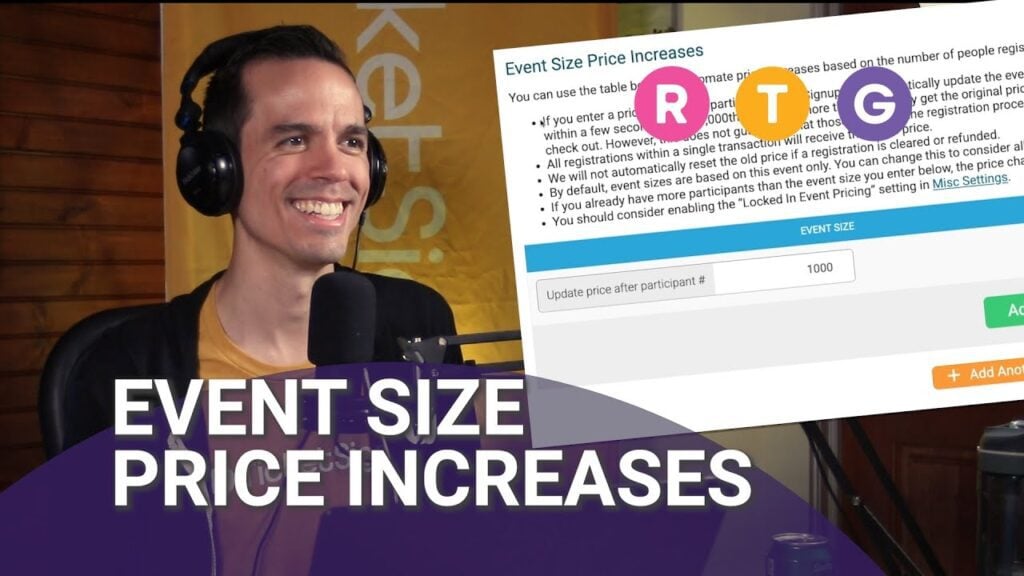
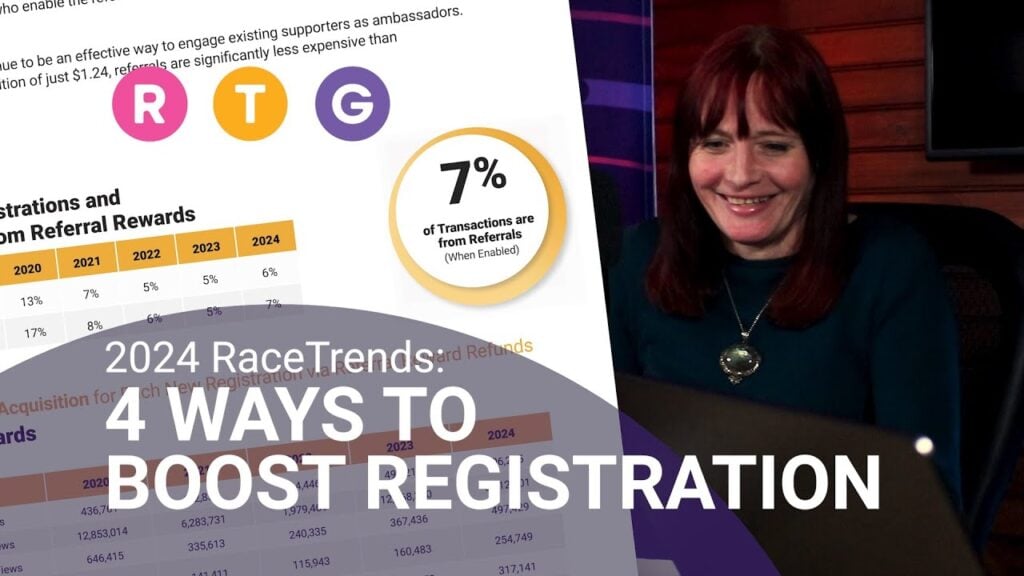
- Growth is slowing; get back to the basics. The fast post-COVID growth rate has slowed. Focus on marketing tactics that increase participation on the margins – 1-2% can make a big difference. Make sure you have enabled automated emails for incomplete registrations and price increases and consider a referral rewards program.
- Large races are still recovering. While large races saw a higher growth rate than most midsized events, there are still challenges for the biggest events. Consider a loyalty program with early-entry or reduced registration to re-engage participants who haven’t returned since 2019.
- The race industry is (possibly too) stable. We always hate to see races die, but some churn is a normal part of the events industry. With churn rate very low, the opportunities for new races may be limited. Focus on optimizing your existing events unless your new-race idea is truly unique and needed in the market.
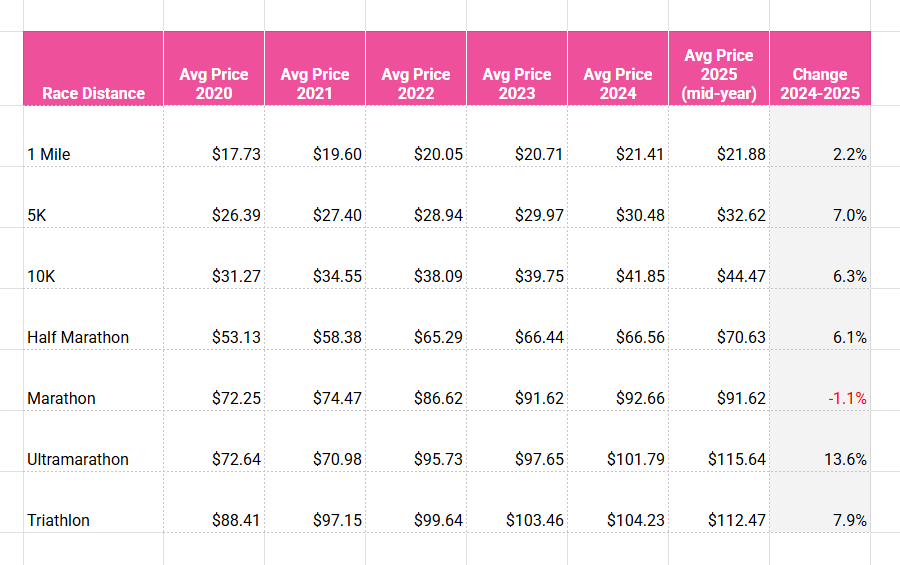
Rising Prices
Prices started rising as soon as in-person events returned post-pandemic. So far this year, most race distances have seen significant price increases. 5Ks, 10Ks, and half marathons all saw price increases of 6-7%, with ultramarathons and triathlons seeing even steeper increases.
Average Event Price by Distance
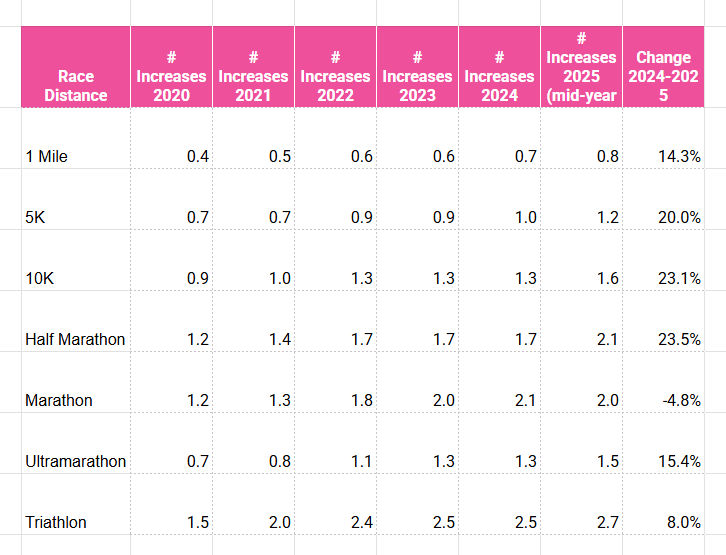
More Price Increases
Price increases are one of the most effective ways to drive action and get participants to take the final step in registration. In 2025 we (finally) saw an uptick in price increases, with most distances adding more price increases to their schedule.
Average Number of Price Increases By Distance
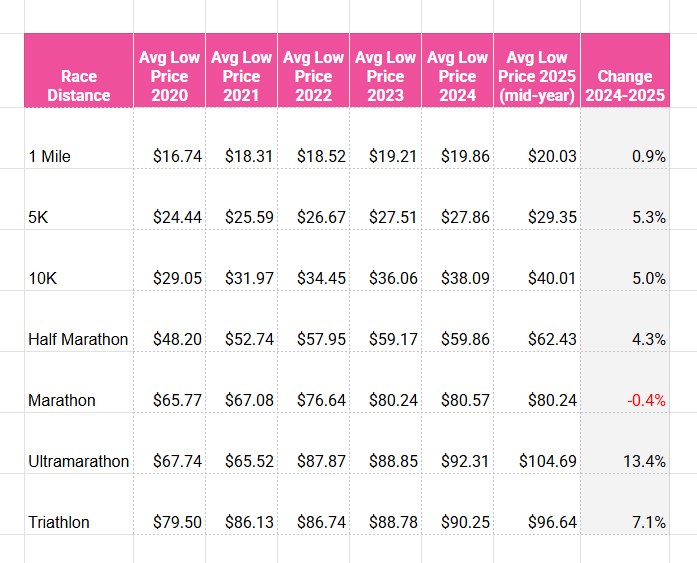
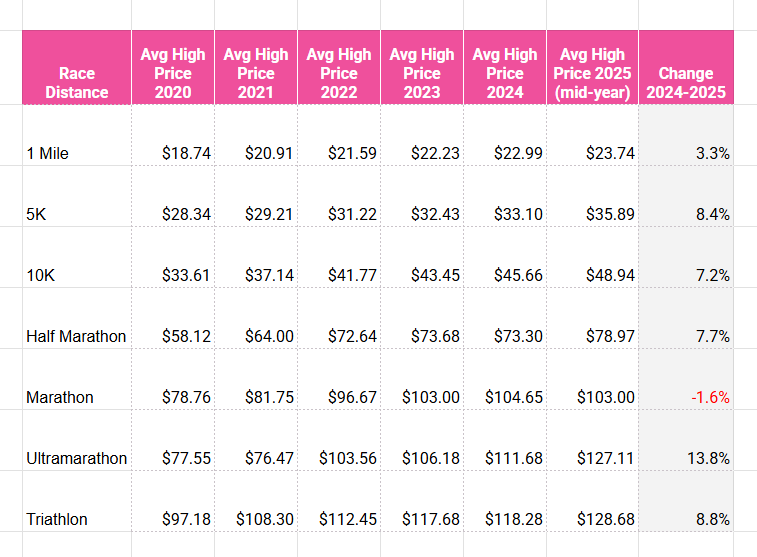
Higher-Highs, Steady Lows
Looking a little closer, the average minimum price (the lowest possible price) stayed relatively stable in 2025. The majority of the increase in cost came with the average high price. Combined with the data above for the number of price increases, it appears that races are boosting revenue by adding an additional price increase at a higher price point than before.
Average Low Price by Race Distance
Average High Price by Race Distance
Key Takeaways:
- Prices are increasing to meet costs. Inflation, rising municipal costs, and uncertainty around tariffs has led to rising prices over the last few years. The steep increases in 2025 suggest that race directors from 2022-2024 may have underestimated the cost changes in the initial aftermath of the pandemic, and are now correcting course with higher prices.
- Price increases are creating a wider range of price options. Race directors are still gun-shy about increasing the base cost of registration. Instead, they are adding additional price increases and/or increasing the cost of late registrations. This is a good way to add revenue while still maintaining an accessible price for runners who are cost-averse. Procrastinators tend to be more willing to pay the cost of waiting!
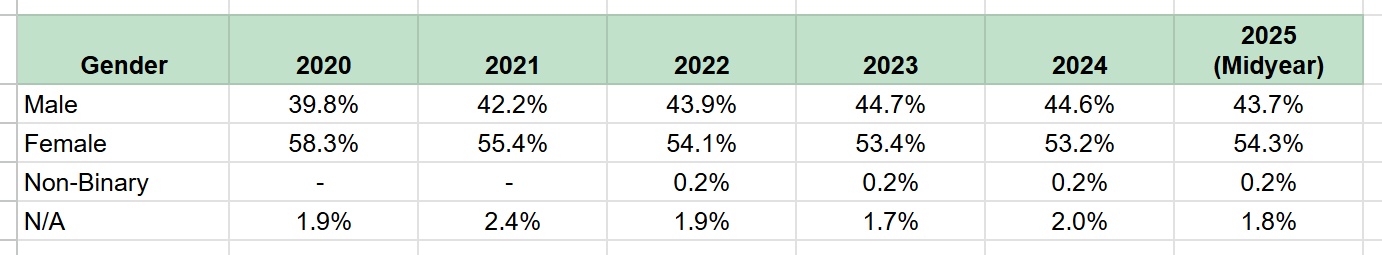
Women Still Lead
Gender identity has remained relatively steady over the last 8 years, taking into account the changes in 2020 & 2021 due to large numbers of virtual events. We have been seeing a very slight evening, with the gap between men and women closing a bit from 2021 to 2024. Early 2025 numbers suggest the opposite, with 54.3% of participants identifying themselves as female.
Gender Trends
Younger Runners Returning?
The participation decline of 18-29 year-olds has been a hot topic for endurance events since pre-pandemic days. 2024 and the start of 2025 suggest a slight improvement, with nearly 18% of 2025 runners between 18-29. That’s fairly on-par with the 18-22% we saw for that cohort in the mid 2010’s.
Age Trends
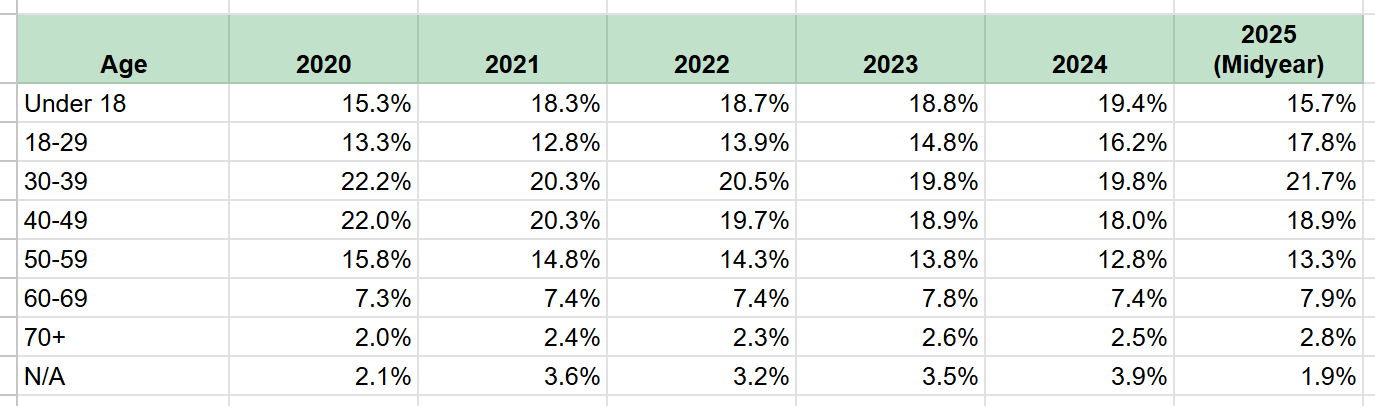
It’s worth noting, however, that decline in participation for under 18 is likely due to the timing of the cross country season. We’ve seen a similar pattern in spring over the last few years. As youth runners increase their percentage in the fall, expect adjustments to other age groups, the 18-29 bracket.
Key Takeaways
- Don’t neglect women in your marketing. Women still make up a majority of the running industry. Make sure they feel welcome and represented in your marketing materials and giveaway items.
- Continue to be creative. Yes, younger runners are coming back to racing, but that doesn’t mean races should get complacent. Experiment with new marketing and communications strategies such as video content, TikTok, and micro-influencers to reach outside the traditional running audience.
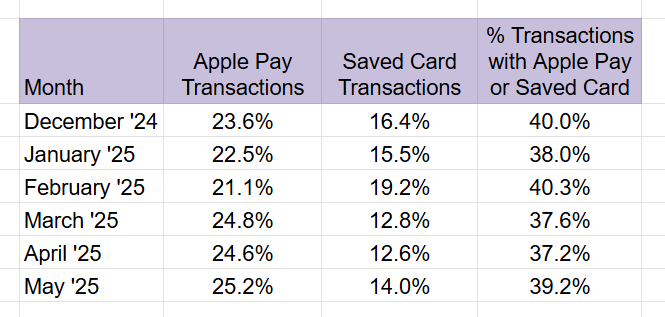
People Like Easy Payments.
Since implementing Apple Pay in July 2023 we have seen a significant number of participants take advantage of the option. In the first half of 2024, 39% of participants paid with either a saved credit card or Apple Pay, highlighting the need for a speedy payment process.
Percent of Transactions by Apple Pay or Saved Credit Cards
Registrants Are Used to Processing Fees
With the introduction of fee transparency pricing in seven states, we have been watching processing fees carefully. Why? Anecdotally, we know that some race directors are opting to absorb the fees (and increase prices accordingly) to maintain a clean fee display.
However, the numbers do not suggest this is happening in any great numbers. In fact, races are passing the processing fees onto participants more than ever before. In 2025, 94% of processing fees were paid by participants.
Percent of Processing Fees Paid by the Participant vs. the Race
.png")
Key Takeaway:
- Easy payment means fewer drop offs. A participant doesn’t count until the checkout is completed. Offer as many fast payment options as possible to limit your drop-out rate.
- Participants are accustomed to processing fees. Whether you’re showing all-in pricing or traditional pricing with the fee added later, participants expect fees.
Quick Tips
It can be hard to keep up with all the latest technology options. As you look to boost registrations (and manage your new participants) in 2025 and 2026, check out a few of our favorite marketing and growth tips from the last few months – all offered in less than 10 minutes.