We have been doing the US race registration market analysis every 6 months for many years. We include a ton of analytical data, and also include our analysis of happenings and directions in the market (of course that analysis is done from our perspective and is sometimes biting to competitors but tries to be honest). This began because we as a business need to take a hard look at how we are doing against a competitive landscape and figured as long as we were doing the analysis, we would share it.
Here are the old Market Analysis reports: September 2015, March, 2016, September, 2016, March, 2017, September, 2017, March, 2018, September, 2018, March, 2019, September, 2019, April, 2020, September, 2020, March, 2021, September, 2021, March, 2022, September, 2022.
Also see our 2022 Race Trends Report, 2022 Largest 100 Races Report and our own 2022 Year in Review Report for more information on the state of the endurance community.
Are Participant Levels Returning to Normal Yet?
We are seeing positive trends for races in 2023, with hints they may return to 2019 levels. It is hard to tell from early registration numbers as spring races are well ahead of 2022 numbers partially due to there not being an Omicron variant sweeping the country the first two months.
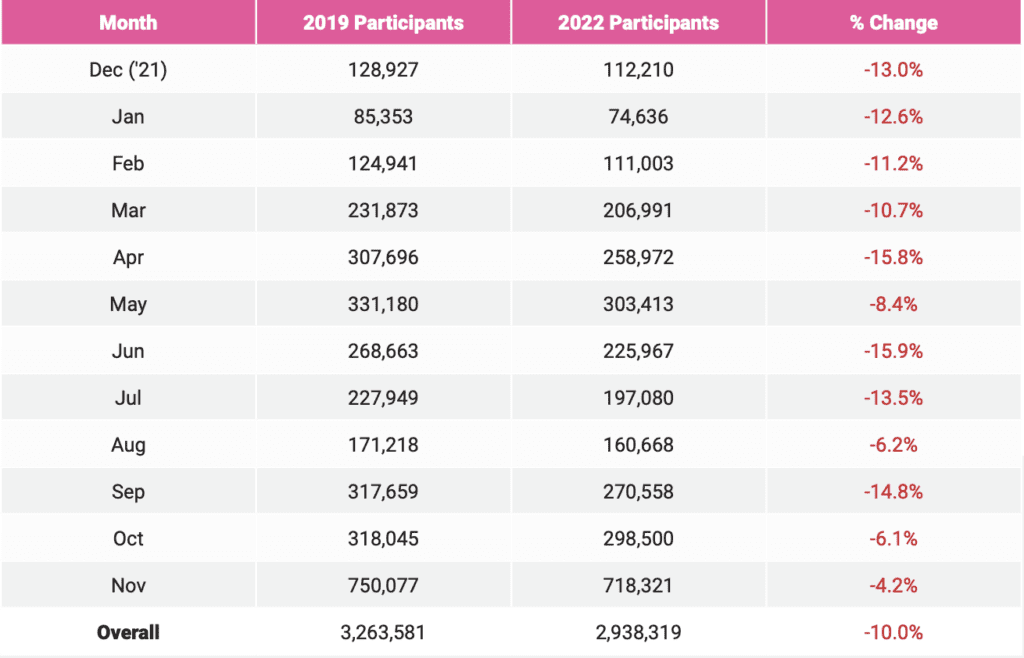
From last year, we saw events down 10% overall from 2019.

This year, we are comparing 2023 numbers to 2022. The early returns for races using our platform in both years happening in January and February are encouraging:

We are also seeing large races like Broad Street, Kentucky Derby Marathon, Crescent City Classic, Richmond 10K, San Francisco Marathon, and Pat’s Run all showing strong early registration numbers that are much better than last year and approaching 2019 numbers. This is in contrast to last year when large races really suffered the most as we reported in our Annual Race Trends Report.

Race Churn
Last year we compared the number of races over 500 participants that happened in 2019 and did not happen in 2022. Overall the average rate averaged 19% on a monthly basis. Looking at this over a 3 year period, this is roughly the 6% per year that we had seen previous to the pandemic. For this year, we are returning to the traditional year over year measure and comparing 2023 to 2022. For January and February the number of races is a small sample set, but average 8% churn (races not happening in 2023 that happened in 2022).
This does not match anecdotal feedback we are getting from many timers, who are seeing old races returning and new races popping up. This might be because some timing firms went out of business during the pandemic, leaving the remaining timing firms more busy than ever.
The other encouraging statistic is that the number of races listed on RunningintheUSA.com is on the uptrend again – about 7% from March, 2022, but still down from 2019:

Vendor Market Share
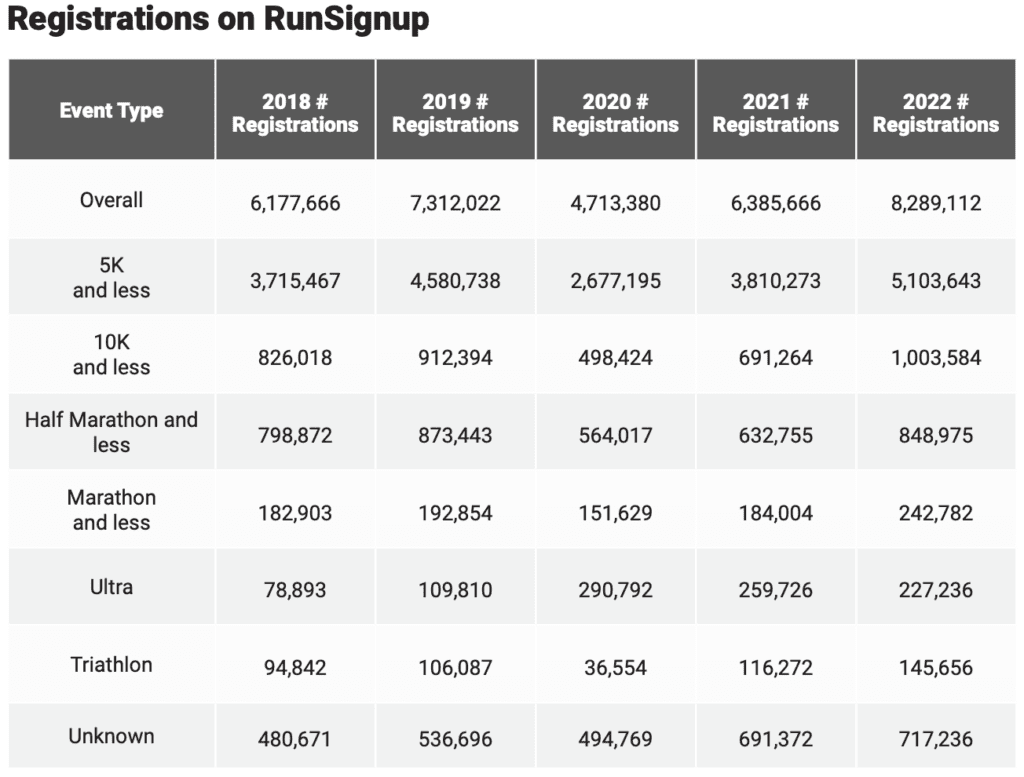
The one set of numbers we can reliably look at are from our 2022 Year End Report. The number of races on our platform increased by 20% and the number of registrations increased by 20% from 2019 in a year when registrations were down 10%+ across the entire community. We reported 8.4 Million Registrations in our annual Trends Report.

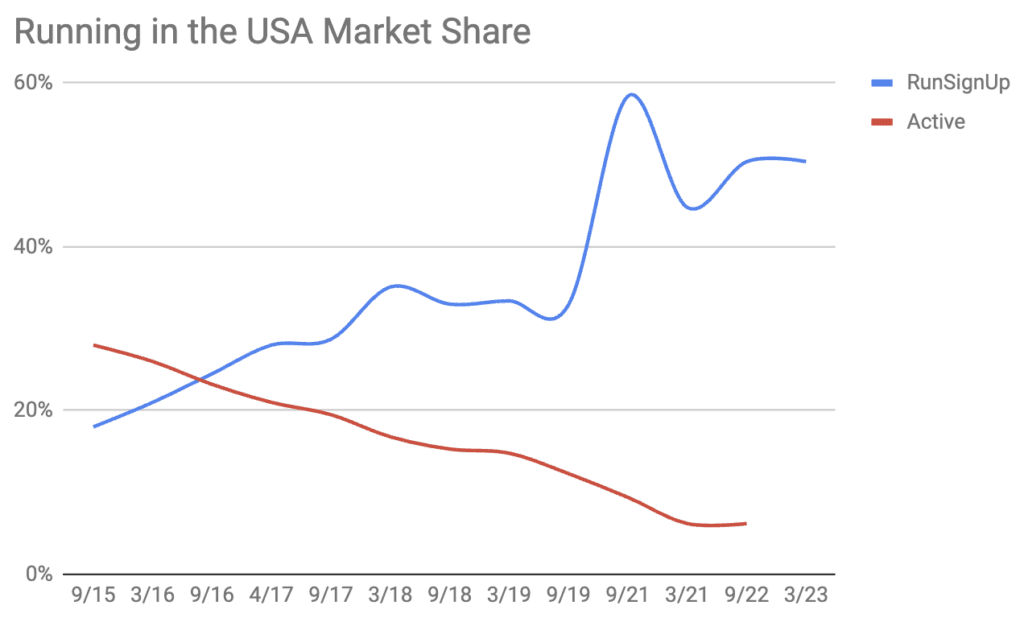
We have also been tracking the number of races in RunningintheUSA.com. They hand curate as well as take automated feeds from RunSignup and up until recently Active.com. They are the source of registration for about 1-2% of the registrations that happen on RunSignup. Active apparently has not been paying their affiliates (RunSignup and up until recently Active run an affiliate program to help races promote themselves automatically). We will continue to update this chart even though it looks like Active data will no longer be available.
We have held pretty steady at around 50% share of this list since the pandemic, up from 35-40% pre-pandemic:

The other more hard data analysis we have is the Largest 100 Race Report which shows the top races. It is interesting to note that the Top 100 account for only 1.3 Million finishers – about 5% of the total number of participants in US Endurance events each year. Some vendors like Active (they also have Ironman, which is huge but does not make the top list from a # of participants per event) and Haku focus predominantly on this top market, while RunSignup has a more balanced approach:

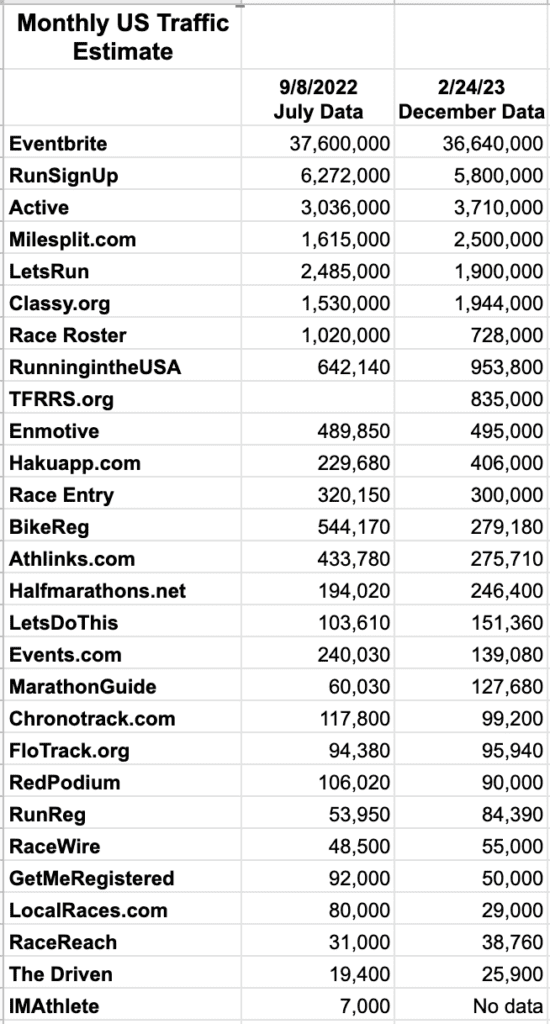
The other data we look at is web traffic in the US. We use Similar Web for this after years of using Alexa (shut down after Amazon bought the domain). Similar Web offers the advantage of showing geographic based traffic, and the estimates below are calculated only for US traffic. For example, over 95% of our traffic is in the US while Race Roster has 57% of traffic in the US and 29% of their traffic from Canada. It is also useful to note that the Active.com domain is also used by other businesses beyond their endurance customers like camps and parks and rec departments that are now a larger part of their business than endurance.

All of this data leads us to conclude that RunSignup has about 40% market share of the endurance market and is likely at least several times the size of other vendors in terms of # of races and # of participants in the US.
Industry Moves
Asics Race Roster Expansion Efforts
Asics Race Roster has been on a major program to expand their business with multiple acquisitions and major concessions on pricing and promises of a lot of operational help to races.
Asics Race Roster has acquired Register Now is Australia, R-bies in Japan (Runnet.jp), and Njuko in France in the past year. Of course this brings Asics into other markets, but it seems they are following a very high cost strategy as they are now supporting 4 platforms. In addition, there is some growing confusion in the market on if they will consolidate on the newer generation technology of Njuko, or keep all 4 platforms, which will dilute new development investment in each. There is also confusion as in each of the geographic markets, Race Roster’s legacy offering is also being used by some customers.
Asics has also been very aggressive with pricing and offering a variety of free services to win customers. Over the past year they have convinced races that had previously used RunSignup to move to their platform, including the Philadelphia Marathon, The Crim, Oklahoma City Marathon and Bellin Run (don’t worry too much about us, we will “churn” only 1-2% of our customers this year and grow more and are also winning some customers from Race Roster – so things balance out). Our understanding is that they have moved away from standard pricing models more toward a “deal” model offering things like 3% processing fees, up front payments, free website design services, taking responsibility for race’s customer service, on-site personnel, etc. Unless Asics is willing to underwrite huge losses because they can sell a lot more shoes with this strategy, this is non-scalable. If all Race Roster customers received equal treatment based on volume, their “deal” approach would fall apart. RunSignup will continue to have a standard volume discount model that is published on our website (see Partner Contract) because we want to treat customers fairly and run a viable technology business for the long term.
Race Roster is also spending big on sales and marketing. We wrote about this a few months ago when our customers began complaining to us about how much Race Roster sales reps were calling. They also had a huge presence at RunningUSA with seemingly everyone wearing an Asics Race Roster hoodie.
It seems obvious to us that Asics is in a big spend mode. They are likely betting on the sell through of their apparel and shoes via many individual race websites, and the collection of the data to sell direct to consumer more and more over time. Big companies make big bets, just like Global Payment acquiring Active a number of years ago for $1.2 Billion. Sometimes they work out, but sometimes there is a mismatch over time and the investment dries up. It will be interesting to watch.
Haku Moves Into Europe and Ticketing
As we reported in September, Haku has been exploring moving into Europe. Race Roster’s move to acquire Njuko may blunt that, as well as the low margins in Europe (Njuko charges only 20 cents Euro for base registration fees). Another one to watch over time.
More recently, Haku has been promoting a ticket offering to customers. Much like RunSignup’s TicketSignup offering, Haku is finding adjacent markets to pursue that are synergistic. Their website does not contain any information on this offering yet, but it will be interesting to watch this unfold as well.
Let’s Do This
As we reported last September, Let’s Do This received $60M in funding and has been spending it. They bought much of the floor space as the central exhibitor at RunningUSA conference this year. They also won Motiv Sports business (moved from Active) with some aggressive financial incentives. They are busy trying to mature their platform to address the full platform capabilities that races have come to expect, and still have a long way to go.
Smaller Vendors
Between the technology and low price leadership advantages RunSignup brings, and the aggressive investment by Race Roster and Let’s Do This, smaller vendors are getting crushed. Since we began this report in 2015, we have seen industry bell weathers disappear, including: IMAthlete, RaceIT, Marathon Guide, RaceWire, GetMeRegistered, Race Partner, SignMeUp, and many more. The level of investment required and the technology expertise to build a complete platform like RunSignup is a very high hurdle. We have talked with a number of these vendors who have $10-20M in transactions flowing on their platform vs. our $400M, and it is simply unsustainable to meet the base security and sales tax requirements, much less offer free email, full fledged websites, free photos, free results and txt messaging, etc.
Much like the recent Silicon Valley Bank, races should be cautious in making sure they have a reliable long term technology provider.
R&D Tax
We wrote about the impact of the 2017 R&D tax changes coming due this year. For RunSignup, our $4.6M in Software Development expense will now be capitalized and written off over 5 years – meaning we will have to pay taxes on the $4.1M that we can not expense for tax purposes this year. At the 21% corporate rate, that is about $850,000 in taxes we will have to pay on our 2022 return in April. We are fortunate to be well capitalized and that will not be a cash flow problem for us.
We are not sure how it will impact others. Race Roster is a Japanese/Canadian firm and it likely has minimal impact to them. It will likely have a pretty big impact to Haku, although they have outside investors who can probably provide the cash needed to pay taxes. Smaller vendors are likely to suffer, or not report their software development expense appropriately.
Summary
With the recovery of the endurance market in terms of # of events and # of participants per event coming back to normal levels, RunSignup, Race Roster and Haku seem to be on a good path forward to gaining market share and have healthy years. Let’s Do This is the new entrant and is likely to try to buy additional market share. There is likely going to be some more consolidation with smaller and older vendors losing market share.
