
We release an annual RaceTrends Report each winter to provide a thorough assessment of the state of the endurance and fundraising events industry. Today, we have a brief update looking at midyear data to help event organizers better understand the current state of the industry.
The Data
The data used for this report includes internal RunSignup data from January 1st-July 1st 2023. The numbers represent 3.8 million registrants from the first half of 2023. We estimate that our data represents at least 35-40% of the endurance market. While our Q2 2023 RunSignup Update looks at how the company is faring, this data tries to determine trends in the overall market and how they may impact individual races.
Growing Races
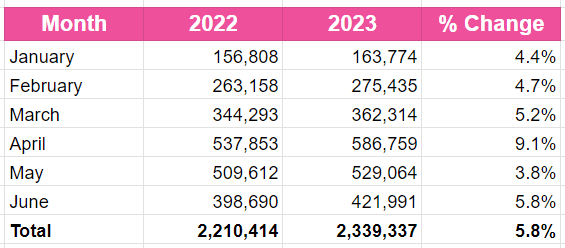
One of the key ways we look at the strength of the market is by comparing the number of participants in races that have been on our platform for two years. This removes any impact of increased market share on our platform or new races in the market, looking only at how participation numbers for races have grown (or not). In early 2023, we see that races are continuing to grow compared to their 2022 size.
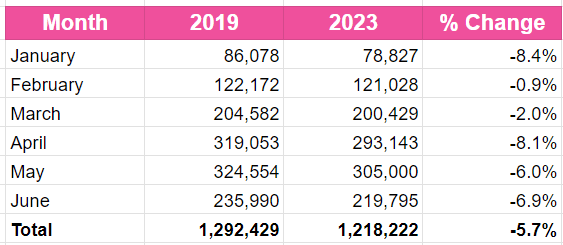
When we step back and look at how 2023 registration numbers compare to 2019, we still see a minor drop in participation for races on the platform in both years. As this gap continues to close, the salience of comparing registrations to 2019 lessens and we are able to focus more on year-over-year trends.
Key Takeaway
- Race participation is still rebounding, and races are growing back in 2023. If you’re setting your budget for later this year, it’s reasonable to expect more participants than last year, but slightly fewer than you had in 2019.
Race Churn
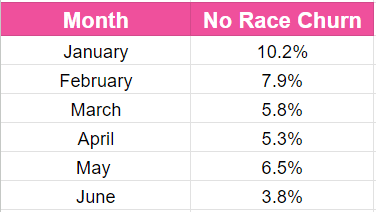
We manually track every race over 500 participants to see how many of them return on our platform, how many leave for another platform, and how many events cease to exist at all. So far in 2023, 6.1% of races that had more than 500 participants in 2022 have not returned for another year. That race churn is in line with pre-pandemic numbers, with 5.5-6% churn rates in both 2018 and 2019.
Key Takeaway
- Some churn is a part of a healthy market, with old races giving way to new and interesting ideas. Watch for races in your region that aren’t returning, and consider how you can take advantage of those gaps in the calendar by either increasing interest in a current race you own, or promoting a new race concept.
Rising Prices
Inflation, increasing permitting costs, and reduced participation have all led to a noticeable increase in registration prices for the second year in a row. Nearly across the board prices have risen since 2019, with all distances aside from Ultramarathons seeing an increase of 5-17% compared to 2019.
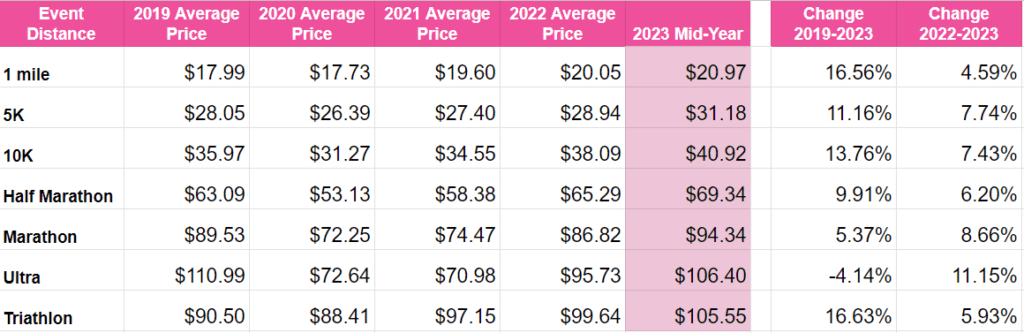
Note: the pricing data from 2020 and 2021 is impacted significantly by the influx of virtual races with lower overhead and thus lower entry prices. Additionally, we believe the pricing data for Ultras is still somewhat impacted by multi-day virtual challenges of more than 26.2 miles.
Key Takeaway
- Prices continue to rise. Focus on your value proposition (what runners get for their money) and opportunities to save by registering early.
- The price of travel is more likely to impact premier events than the price of the actual race. Make sure you’re marketing to local runners, too – they may be looking for local races to replace one they previously travelled to.
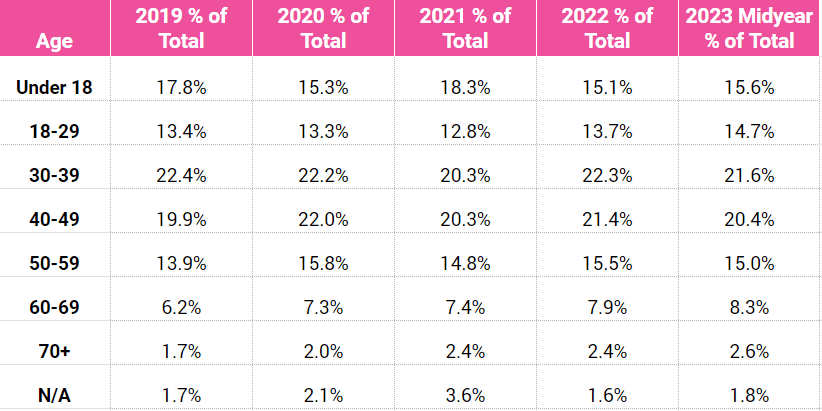
Are Younger Runners Returning?
The biggest question we’ve heard throughout our conversations with customers this year has been “how do we reach younger runners”? In a possible bright spot, the percentage of participants between 18-29 in early 2023 has increased from 13.7% in 2022 to 14.7% in early 2023. This is, however, still noticeably behind the participation levels of 18-29 year-olds in 2015-2018. In those years, the participation level ranged from 18-22%.
Key Takeaway
- While participation by younger runners may be improving, there’s still work to be done. Continue to experiment with new marketing strategies, video content, and creative race concepts with social elements.
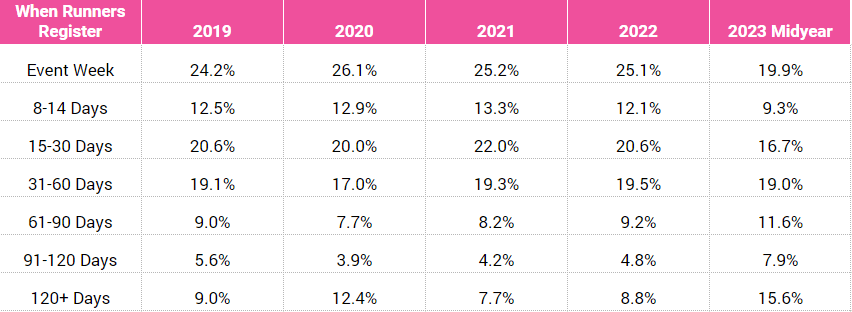
Procrastination is Down
Over the last few years, we’ve seen a steady 24-26% of registrations coming in on race week. Early data from 2023 actually indicates that fewer runners are waiting until race week, with just shy of 20% of registrations in that week. Before you take this as a suggestion that runners are planning more, though: the first 6 months of 2022 showed similar data, but over the course of the year the percentage evened back to 25%.
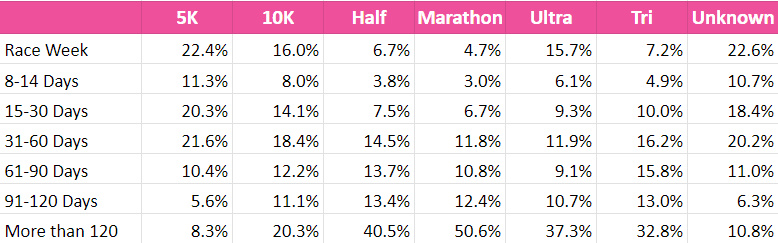
Looking at registration data by race distance, it’s easy to see the impact that race type has on registration patterns. Races that require significant training, such as half marathons, marathons, ultramarathons, and triathlons, see a majority of registrations several months before race day. On the flip side, more than half of all 5K registrations take place within the last month.
Key Takeaways
- Registration patterns can be unpredictable, but use data from previous years to gauge your likely late registrations and improve ordering accuracy.
- For longer races, open registration early and begin marketing immediately – challenging races require an extended commitment and plenty of time for preparation.
Recommendations
Early indications from 2023 are largely positive, with registrations rising and younger runners returning. But with slow progress on both fronts and headwinds from rising prices, it’s important to keep your foot on the gas and keep up with all the latest tools and technologies to help you grow your races.
As you plan you marketing strategy for the remainder of 2023, check out a few new video recommendations from our team:


And if you’re looking for a new revenue stream for your race (while providing a little peace of mind to your participants), we recommend enabling the new participant insurance option from Protecht RegShield.