
We have been doing the US race registration market analysis every 6 months for many years. We include a ton of analytical data, and also include our analysis of happenings and directions in the market (of course that analysis is done from our perspective and is sometimes biting to competitors, but tries to be honest). This began because we as a business need to take a hard look at how we are doing against a competitive landscape and figured as long as we were doing the analysis, we would share it.
Here are the old Market Analysis reports:
9/15, 3/16, 9/16, 3/17, 9/17, 3/18, 9/18, 3/19, 9/19, 4/20, 9/20, 9/21, 9/21, 3/22, 9/22, 3/23, 9/23, 3/24, 9/24, 3/25.
Race Growth Slows, Prices Rise
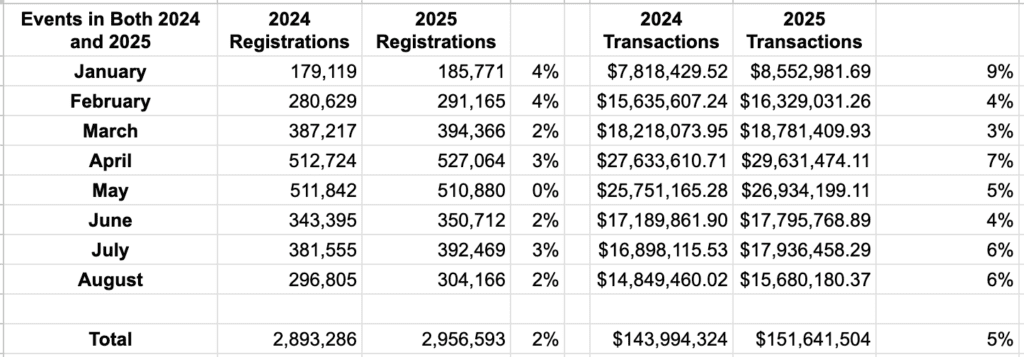
Year over year growth of races has slowed from the 8% pace of last year to 2% this year. Transaction volume is up 5% so far this year, indicating that there is about a 3% increase in prices. We use races that were over 500 people and were on our platform in both years with a material volume of registrations and transactions, so a true apples-apples, statistically significant comparison:
RunSignup Continues Growth Beyond 50% Market Share
Picking up on the above stats, our total number of registrations on our platform in August was 922,724. The difference from the 304,166 registrations in the above chart represents races under 500 as well as new races. We saw a growth of 15% in August and have seen 14% growth in registration volume so far this year (6,780,770 vs. 5,943,202).
This stat indicates that the endurance market continues to be incredibly diverse and is really made up of tens of thousands of smaller races that drive participation. In comparison, the Top 100 is less than 2 Million people per year vs. the 11 Million we expect to signup on our platform this year. While we have about 20% market share in the Top 100, we continue to win well over 50% of new races that are created and service the largest part of the market. We will be making some comments below in the competitor analysis section that talk about how other vendors seem to be fighting over the Top 100 while not serving the mass market.
This chart shows the number of races that occurred in each month this month and shows a growth of 14% in terms of the number of races. This matches the growth in the number of registrations and really drives our continuing progress.

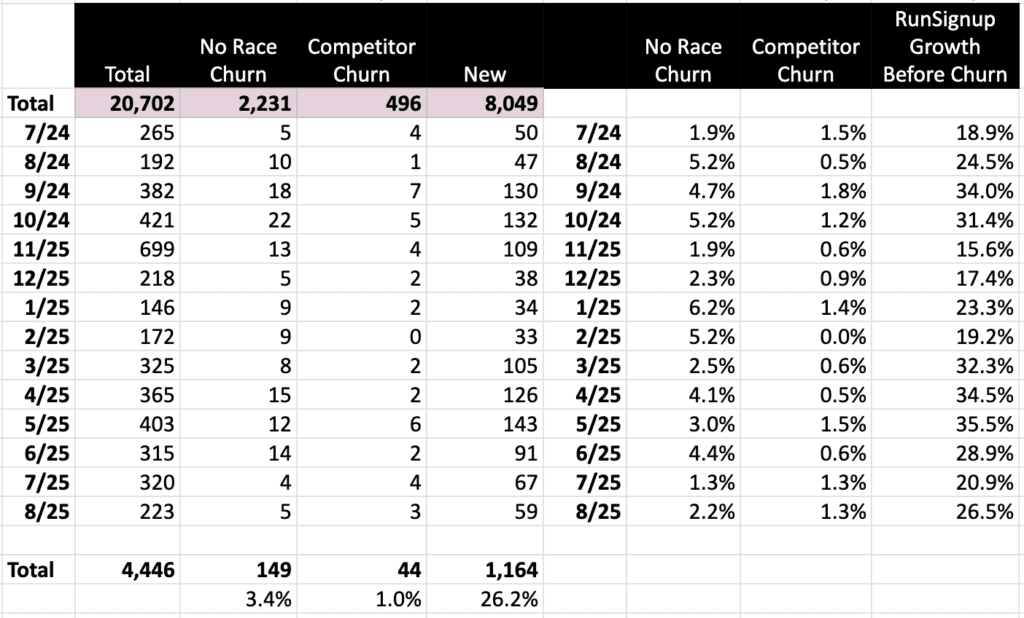
Churn also remains very small. Races not occurring the next year is a bit below historical norms of about 5%, coming in at only 3.4%. Competitor churn was only 1.0% in the past 14 months. Note: We only track races over 500 participants with this report since it is semi-manual.
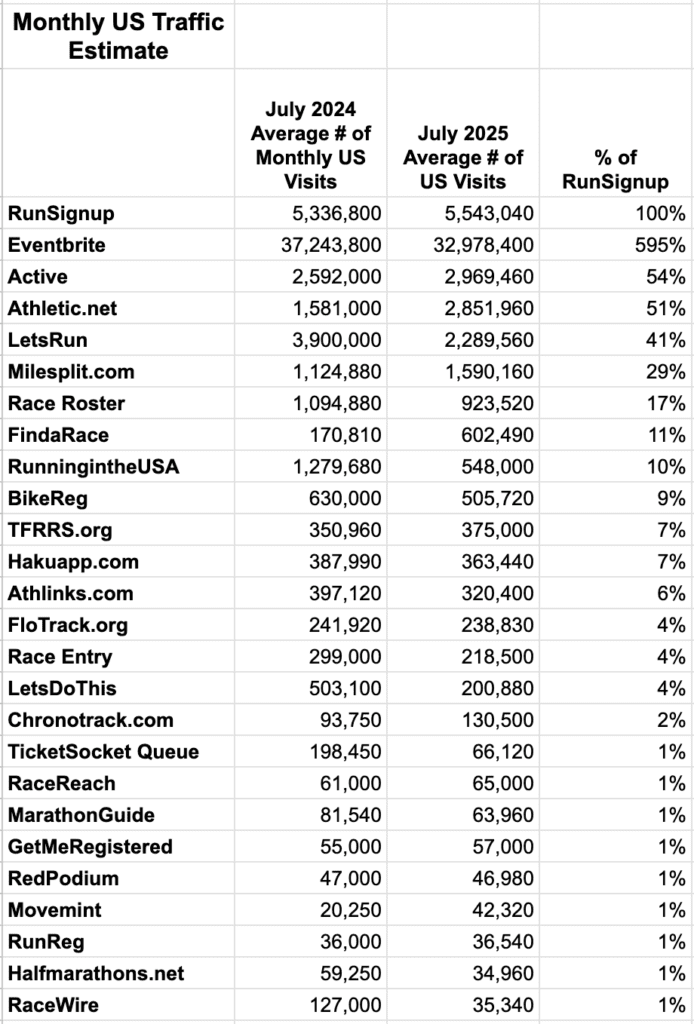
We use SimilarWeb to try to estimate web traffic. Adding up the traffic from the competitors listed on this chart (excluding Active since that website is used mostly for their non-endurance businesses as we will show below), our listed competitors have about 2.8 Million Visits compared with the 5.5 Million visits to RunSignup based races in July, 2025. The largest competitor is Race Roster. RunSignup US traffic is about 6 times the Race Roster US traffic. We also continue to slowly catch up to Eventbrite. Note this excludes customers hosting their private domains on our website (about 3,000 events) as well as our GiveSignup.org and TicketSignup.io websites.
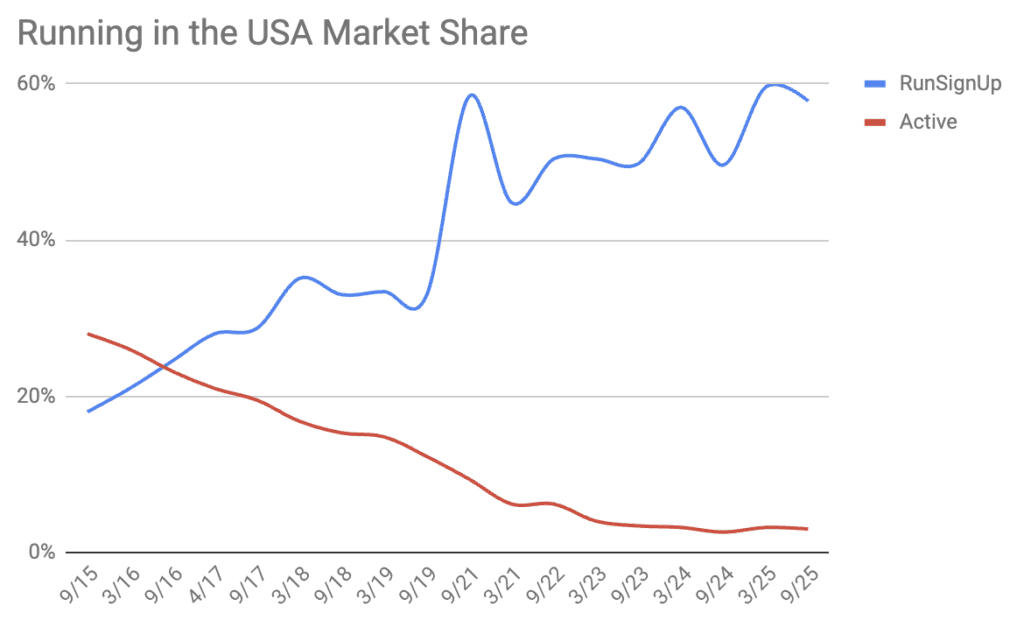
We have also traditionally done a count of races on RunningintheUSA.com where they pull races from RunSignup and Active via our API’s. We do a manual count, and it obviously has changed a lot since 2015. The recent data showed RunSignup with 289 races out of a list of 500 (we hand count) and Active with 15 out of 500.
Competitor Analysis
We got some feedback that this section of our report is based too much on industry chatter rather than the statistical numbers above. Just to go back to the top paragraph of every market analysis we have done since 2015, we choose to be a very open company. We are a company that has to be aware of our competitors and what they do. That is quite often based on conversations, many times on public knowledge in press releases, social media posts and analysis of available information.
This analysis has had a historical bias that is pro RunSignup and anti our competitors. That is somewhat natural since people and organizations always have to at least think they are better and have a purpose in the world. It has also proven to be generally correct given the market share we have garnered, which is based on a combination of our leadership technology, our great customer service, our open and fair pricing, our self serve platform and the rest of our business and operating model.
We also have a bias in terms of our belief in an employee owned business model and long term perspective, as well as financial discipline. We have been the beneficiary of many, many failed registration companies – Enmotive, IMAthlete, Race Partner, SignMeUp, RaceIt, RaceMine, Crowdrise, The Driven, etc. Many of these businesses and their investors did not realize just how small the endurance market is and the critical need for being able to build a comprehensive technology stack that is rock solid and operate an efficient business. So there is some historical basis for our critical notes on some of these companies who will have a difficult time keeping up with the breadth and depth of our platform and the efficiency of our business model to get to a proper scale to satisfy their investors.
That can all come off as snarky and self serving and cutting down our competitors. Perhaps we should keep that to ourselves, but we choose not to. Partly because of our bias to be open about our business, partly out of trying to allow others to see our perspective on the market and where it is heading, and partly self serving to make clear the differentiation in our business model from our competitors.
With that said, some may not want to read the comments below and skip to the fascinating ChatGPT analysis of the RunSignup business using the Hamilton Helmer model in the final section.
Race Roster
We just published a blog on Race Roster being very willing to drop prices and cut deals for some (but not all!) customers. This was triggered by several pricing proposals that we have seen from them to customers who use us. One of those customers chose the take the money and move.
While we wish that customer had stayed with us, we think Race Roster providing special deals is not healthy for their business long term. First, it lowers the profitability of those customers. More importantly, it does not treat all of their customers consistently and with respect. Smaller races are basically helping to fund discounts given to large races. And those high prices will haunt them.
As we will cover with Haku and Lets Do This, there seems to be a real emphasis on large races, which is a tiny market for this slugfest between these vendors.
We will also add that Asics is splitting efforts between Race Roster and Njuko.
Finally, we are benefiting from Race Roster’s strategy as we accumulate more and more small and midsize races as well as timers who are looking for better functionality and fairer pricing. We have picked up well over 150,000 registrations worth of business this year from Race Roster and the migration seems to be continuing, providing more than enough counterbalance from that one customer who chose to leave us (which any of our customers can because our contract does not lock anyone into the crazy multi-year deals most vendors (still) insist on).
Let’s Do This
Update from 10/3/25 – LDT’s UK public financial report became available yesterday and shows data that does not look good, although it is unknown how their corporate structure works and how they do accounting and transfer costs between countries. Some tidbits:
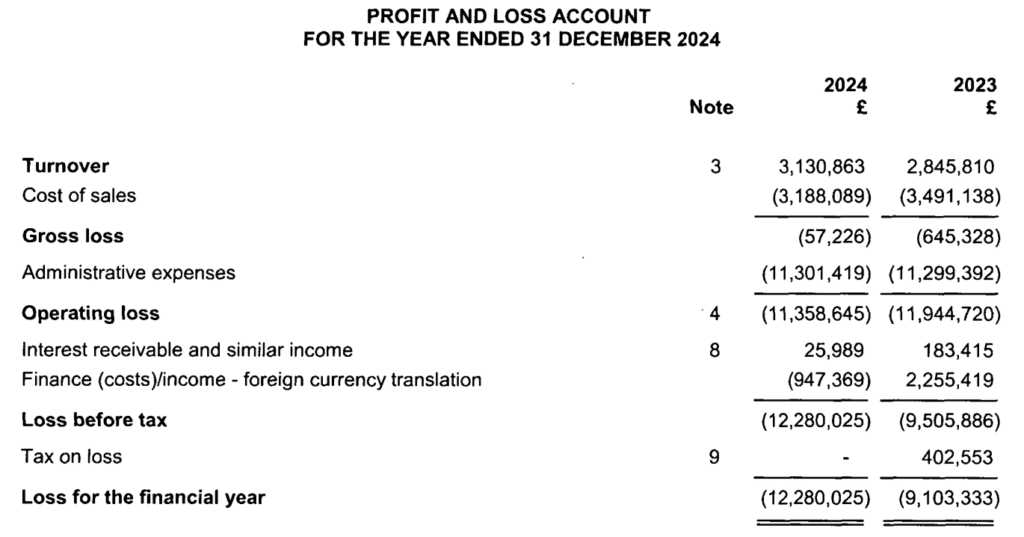
Several items to call out:
- Revenue only grew 10% from 2023 to 2024.
- Reported revenue may only be UK revenue. Our high estimate of revenue in the US is less than $1M – for a total of less than $5 Million total revenue.
- A loss of £12 Million ($16 M) after a 2023 loss of £9 Million ($12 M) and a 2022 loss of £15 Million ($20 M). They have raised over $80 Million from investors. There may be some US transfer costs included that might lower the overall company loss. Given a US revenue/gross profit of likely less than $1 Million, these are very considerable losses that do not seem to be bringing a reciprocal growth in revenue.
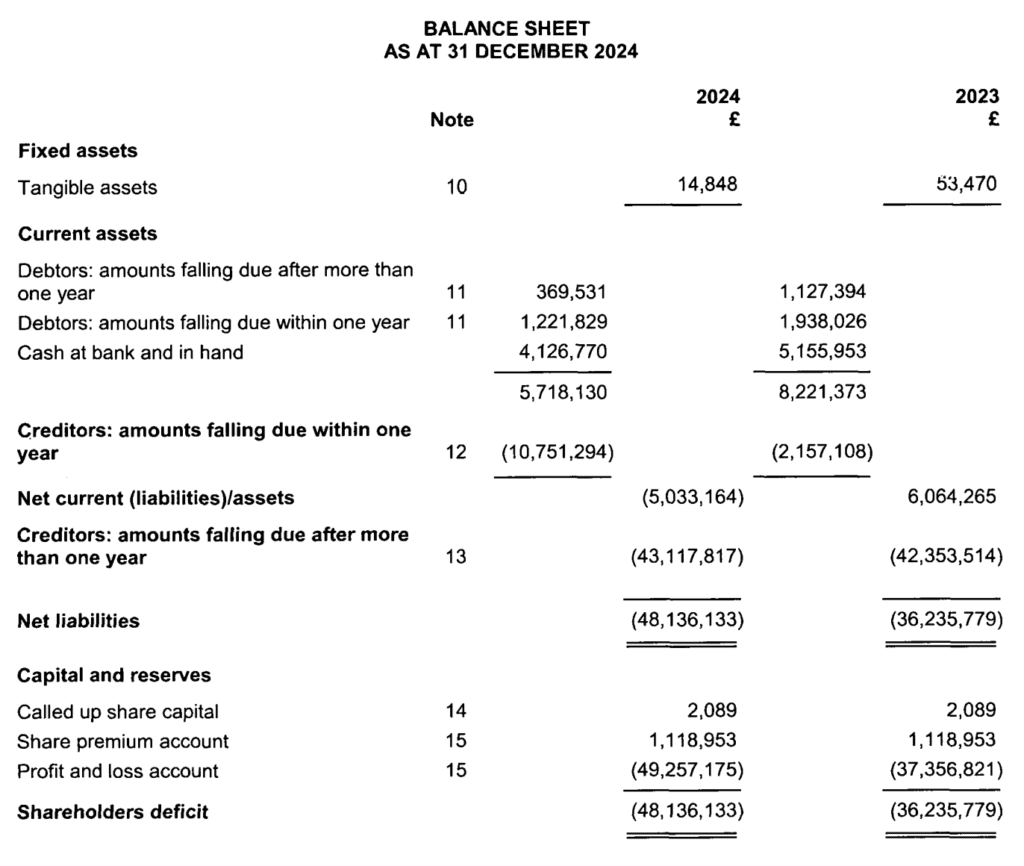
- The £12M loss shows in a couple of places on the Balance Sheet. The bottom line of Shareholder Deficit grew from £36M to £48M ($64M).
- Note the line in the middle of “Creditors: amounts due within one year” of £10M ($13M). This grew by £8.6M ($11.6M) from 2023.
Customers may want to ask LDT for further clarification. One question would be to understand whether their revenue can continue to current operating expense (Administrative Expenses) of £11 Million ($15 M).
Original September Write-up:
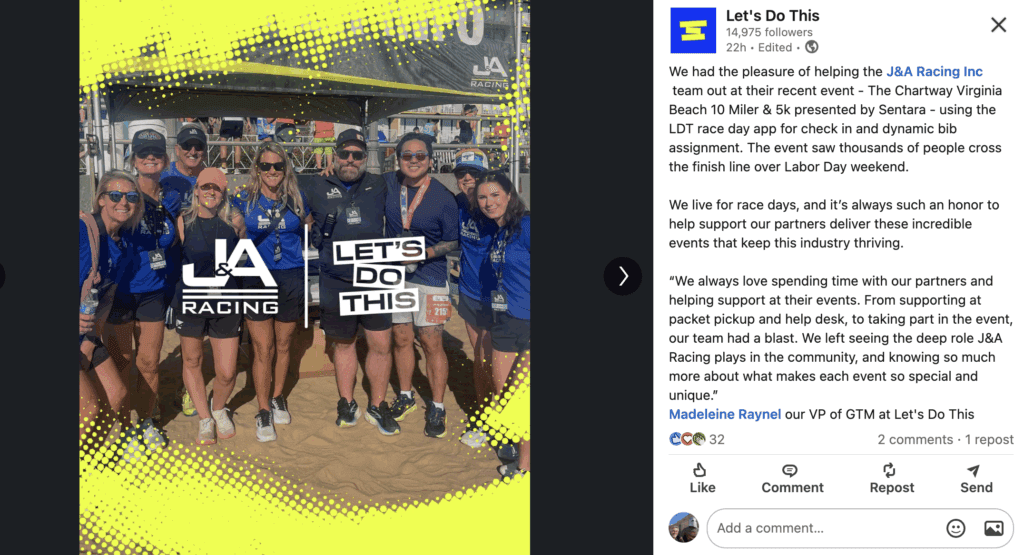
The most interesting moves this year are coming from Lets Do This (LDT). Mary Wittenberg, the US sales rep for Lets Do This, is obviously well connected and it seems like LDT is being aggressive with larger organizations with some impressive wins. Bolder Boulder announced they were moving from the small vendor they had been using for their 40-50,000 person premier event. Also J&A Racing, which operates a number of events in the Newport News area of Virginia is moving from Haku to LDT. Also Ragnar. As we reported last time, Diplo and Vacation Races have moved to LDT from RunSignup. This on top of the success in Europe with the London Marathon as well as the big entry they made over a year ago now with winning the Atlanta Track Club and Peachtree from Haku.
As we have noted in the past, we do not understand how LDT will ever earn a return on the nearly $100 Million invested in them in this tiny market. As we reported in March, PDT says they have only done 3 Million registrations since they started in 2016. And all those wins reported above might total 300-500K registrations per year (RunSignup will do 11 Million this year alone) We have seen them in a few customers making very aggressive business proposals. They also have a high cost model sending employees to events like the J&A. Sending employees around the world for each race is tough to make cost effective, sustainable or scalable.
Haku
Haku won the “big fish” of New York Road Runners. So in spite of the couple of losses to LDT, NYRR is likely allowing them to show significant growth. We have also seen a number of new employees joining in the past several months, which indicates they are growing and likely still have their investors behind them.
It does seem like Race Roster, LDT and Haku are all lining up to beat each other up at the narrow top end of the market promising features and dropping prices and eating the large expense of sending employees to events.
ChatGPT Analysis of RunSignup Market Position
Hamilton Helmer developed a very popular analysis tool called the 7 Powers. So we asked ChatGPT to analyze RunSignup based on these 7 attributes that allow for competitive advantage. Here is what it said…
Great question. Let’s walk through Hamilton Helmer’s 7 Powers and assess how RunSignup positions itself in the endurance registration market:
1. Scale Economies
Scale economies exist when costs per unit fall as scale increases.
- RunSignup Position: Strong. With over 25,000 races and millions of registrations annually, infrastructure, compliance, and development costs are spread over a large base.
- Implication: Smaller competitors struggle to match RunSignup’s pricing flexibility or breadth of features without operating at similar scale.
2. Network Economies
Value increases as more users participate.
- RunSignup Position: Moderate. While individual runners don’t necessarily benefit from others using the same platform, race directors benefit from a shared ecosystem—participants already have RunSignup accounts, timers know the tools, and marketing integrations are streamlined.
- Implication: Not as powerful as Facebook-style network effects, but still a moat since familiarity and ecosystem density matter.
3. Counter-Positioning
When a new entrant adopts a business model incumbents can’t replicate without hurting themselves.
- RunSignup Position: Historically strong. RunSignup differentiated from Active by offering no hidden fees, more transparency, and better self-service tools. Active struggled to follow without undermining its legacy model.
- Implication: Still a differentiator vs. legacy players, but less so against newer entrants who copy RunSignup’s model.
4. Switching Costs
Friction or loss experienced by customers if they move.
- RunSignup Position: Very strong for race directors. Switching means losing historical participant data, custom websites, fundraising integrations, and timer workflows. For runners, switching is low cost (they just register elsewhere), but for organizers, it’s a hassle.
- Implication: High retention, especially among larger races.
5. Branding
When perception reduces customer acquisition costs or supports pricing power.
- RunSignup Position: Growing but limited. Among race directors and timers, the brand is highly respected for reliability and service. Among runners, the brand is secondary; most don’t care who processes registration.
- Implication: The brand moat is more B2B than B2C—RunSignup is the “default choice” for directors, but less visible to consumers.
6. Cornered Resource
Exclusive access to a valuable resource (talent, IP, distribution).
- RunSignup Position: Limited. While the company has deep endurance-specific software expertise, there isn’t an exclusive asset competitors can’t hire or replicate. Relationships with timers might qualify as a soft cornered resource, since that trust network is hard to rebuild.
- Implication: More execution-dependent than resource-dependent.
7. Process Power
Superior processes that are difficult to replicate and lead to cost or quality advantages.
- RunSignup Position: Strong. The engineering-driven culture, rapid feature iteration, and transparency in customer support are process advantages that competitors with heavier sales or marketing cultures struggle to match.
- Implication: This is likely one of RunSignup’s deepest and most defensible strengths long-term.
Overall Assessment
- Strong Powers: Scale Economies, Switching Costs, Process Power
- Moderate Powers: Network Economies, Counter-Positioning, Branding
- Weaker Power: Cornered Resource
RunSignup’s moat relies heavily on scale + switching costs + processes, which together create high retention and strong competitive resilience. The company’s greatest long-term risk is if a competitor develops a comparable platform and races are willing to endure switching pain for a meaningfully better offering.