
We have been doing the US race registration market analysis every 6 months for many years. We include a ton of analytical data, and also include our analysis of happenings and directions in the market (of course that analysis is done from our perspective and is sometimes biting to competitors, but tries to be honest). This began because we as a business need to take a hard look at how we are doing against a competitive landscape and figured as long as we were doing the analysis, we would share it.
Here are the old Market Analysis reports: 9/15, 3/16, 9/16, 3/17, 9/17, 3/18, 9/18, 3/19, 9/19, 4/20, 9/20, 9/21, 9/21, 3/22, 9/22, 3/23.
Also see our 2022 Race Trends Report, 2022 Largest 100 Races Report and our own 2022 Year in Review Report for more information on the state of the endurance community.
Are Participant Levels Returning to Normal Yet?
This year we are seeing a return to near 2019 numbers in terms of participants registering for the same event. We measure races that were on our platform in both 2022 and 2023 to show a normalized growth rate for participants. Note that 2022 was down 12% overall from 2019 numbers, while this year is up 6% overall so far.
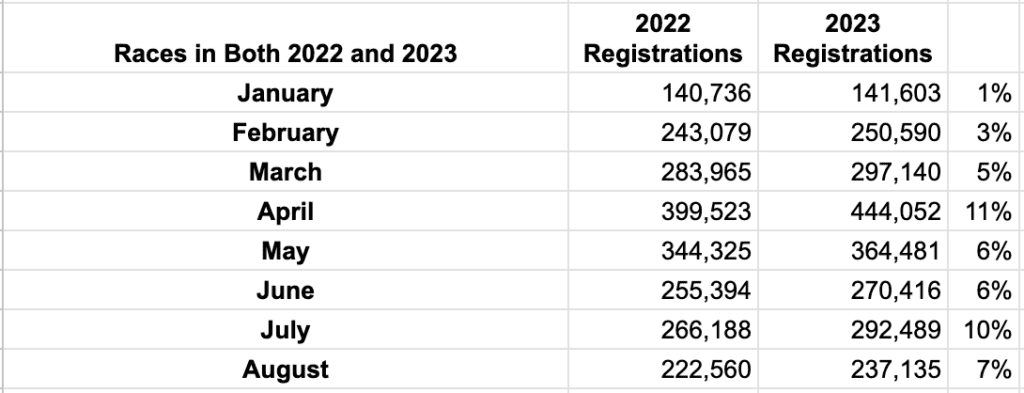
We will not do the full analysis until our year end Race Trends report, but anecdotally, we have seen a return to near or above 2019 numbers for large races. In the March, 2023 report, we showed how large races were down the most in 2022 compared with 2019 while small races were actually up from 2019 participation rates.
Race Churn
Race churn is a measurement of the number of races that happened in the past, but did not happen this year. There are two reasons for “churn” – one is the race simply does not repeat. These are most often smaller events, so the impact on overall registrations is somewhat muted by the churn when looking at the race community as a whole. The other type of churn is when a race moves to another platform – we track this to see if we are on a trend of not doing a good job for our customers.
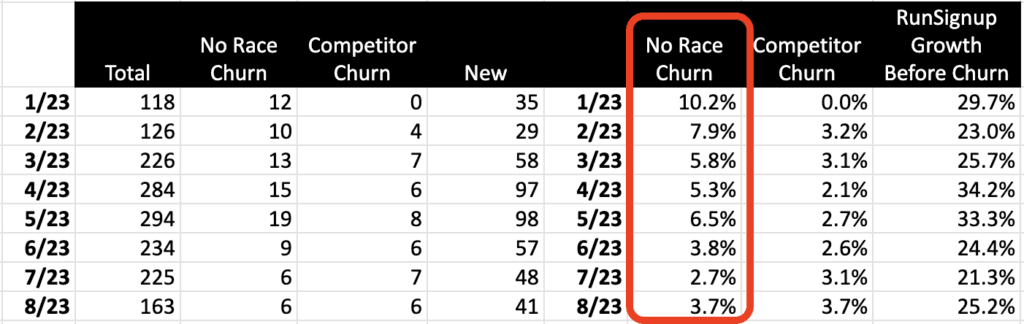
The chart below is a measurement of only races that are over 500 participants. For industry impact, look at the column in red, and it shows that churn has reached the more pre-pandemic numbers of ~5-6%.
Vendor Market Share
This is always a tough number to come up with since none of our competitors publish their numbers. But we can make estimates based on a number of inputs. We can start with the chart above, which shows RunSignup losing 90 races to “no race”, and losing 44 races to competitors, but adding 463 new races. So this metric says we continue to pick up registrations. Also, our Q1 and Q2 reports showed registration growth of 12% and 14%. Year to Date (Sept. 13), we have 5,532,864 registration vs 4,919,153 in 2022, which is a 12.4% increase vs. the data in the first section saying that events are seeing growth of 6%. So our market share continues to grow. In the past we had estimated our market share being in the 35-40% range, and we are now thinking towards the upper end of that range.
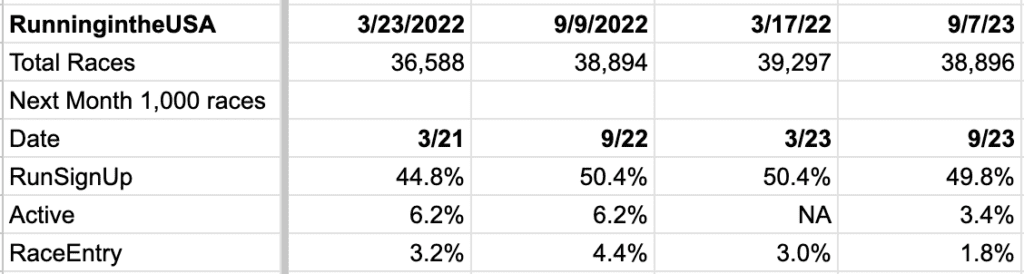
Another way we have kept track of for a long time is the % of events on RunningintheUSA.com that have a RunSignup registration link. This continues to be about 50%:
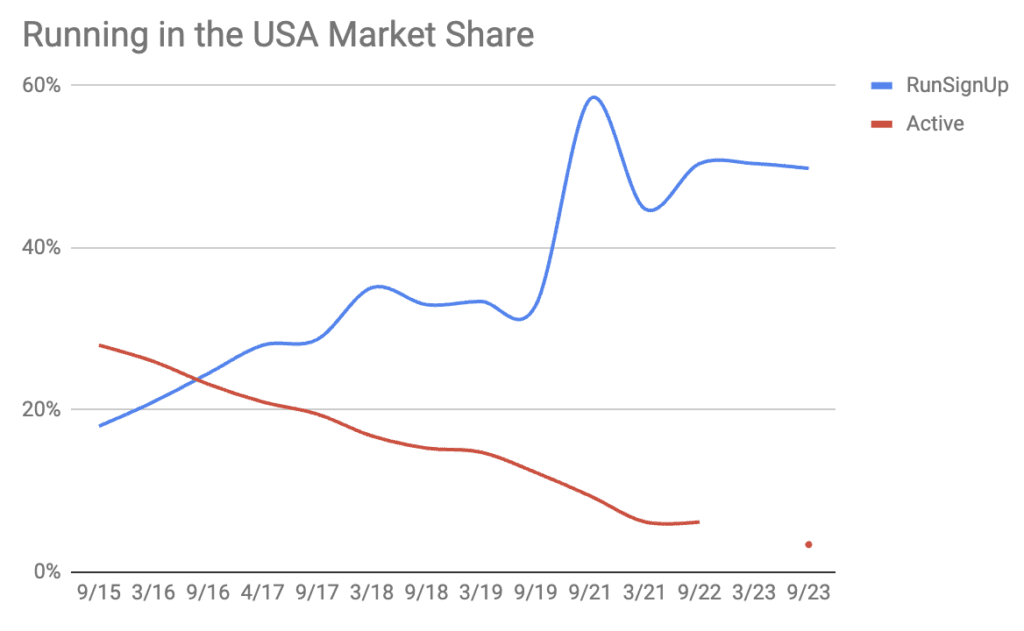
The other non-exact way of measuring data is from comparing web traffic. We had to shift to SimilarWeb last year (see the September, 2022 market analysis for a fuller explanation):
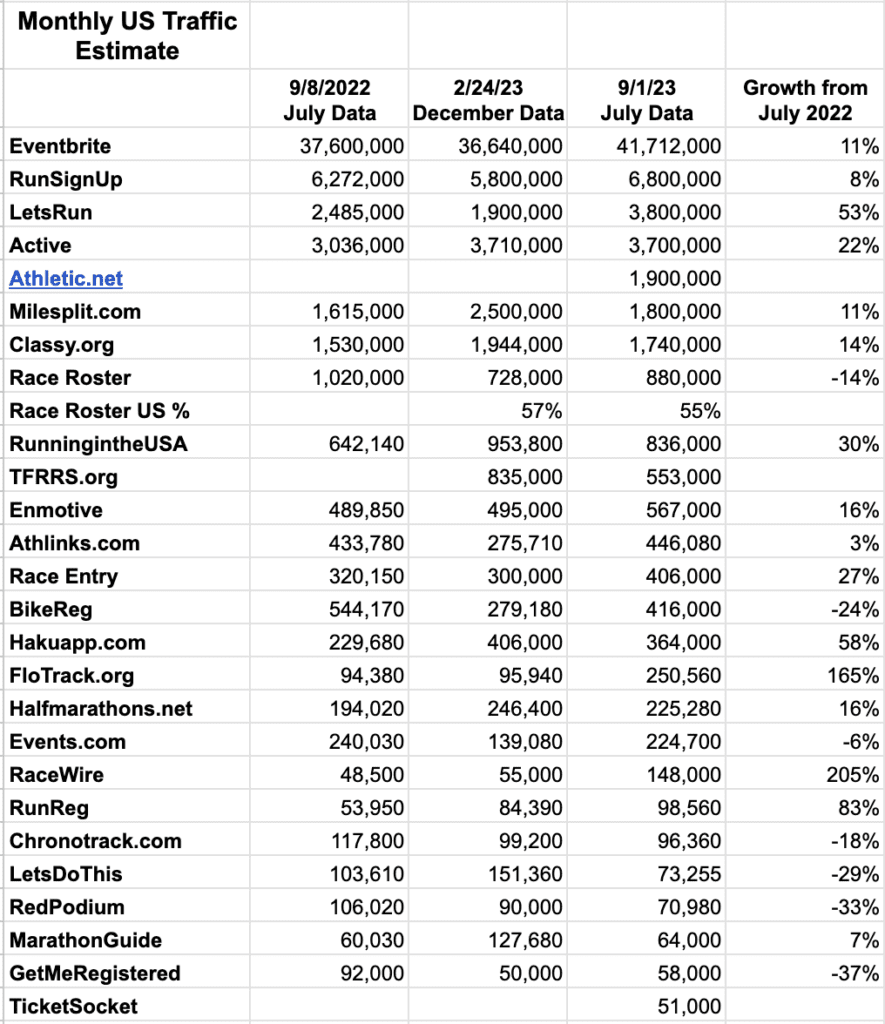
Several notes on this. The RunSignup data looks like it is only for the RunSignup.com domain, and does not include GiveSignup.org or TicketSignup.io. There is also considerable traffic now going to domains that customers have set up for their RunSignup websites (ScottCoffeeRun.com for example). There are over 1,600 of these websites now. Our overall traffic to our platform as measured by Google for July was actually 7,878,900. So about 1 million pageviews are not included in our totals above. We are also seeing increased use of the “BYO Domain” feature we offer with our full website capability we offer customers.
Active data also includes their other markets like camps and Parks & Rec departments.
Race Roster and Haku are generally thought of as the next two largest US registration vendors. Our traffic of 6,800K vs. Race Roster at 880K (13% of RunSignup traffic) and Haku at 364K (5% of RunSignup traffic) is probably disproportionate to our relative market share size in spite of our traffic probably being higher than the 6,800K due to the custom domains. This is due to the fact that RunSignup provides full websites with multiple pages by default and many customers build them out with additional pages. In addition, our results and photos pages also account for large numbers of page views compared with these two competitors.
Race Entry proves the point that these stats are hard to get exact, as their traffic volume went up 27% but their share of races on RunningintheUSA went down from 4.4% to 1.8%.
Also, note how large the ticket market is with Eventbrite’s numbers. That shows why RunSignup has expanded with TicketSignup.
Industry Moves
Race Roster
There is an article in irun.ca that has this quote “Race Roster, the registration tool used by many Canadian races, reported that their running events, on average, are up 25% versus 2019”. Given our comparable race numbers above, we are thinking this is more likely their total registrations (ours are up 32% year to date from 4.1Million to 5.5 Million compared with the similar timeframe in 2019). Of course, it would be interesting to see other vendors report numbers similar to what we do.
We have reported about the aggressiveness of Race Roster as well as them winning several mid to large size customers from RunSignup over the past year (including giving very aggressive pricing and packages to the Philadelphia Marathon, The Crim, Oklahoma City Marathon and Bellin Run (don’t worry too much about us, we will “churn” only 1-2% of our customers this year to competitors and grow more – we are also winning some customers from Race Roster – so things balance out)).
However, it seems that their aggressiveness may be waning some. Anecdotally, we have not seen any material recent losses of customers to Race Roster. In addition, we had heard that they raised prices from some timers who are getting a larger revenue share. However, that revenue share seems to be coming from increased overall pricing. They do not publish pricing (unlike RunSignup), but we went in and set up an event and tried different event pricing to try to understand their most recent default pricing.
| Race Roster | RunSignup | RunSignup > 5,000 Reg | |
| Per participant | $1.99 | – | – |
| Per Transaction | – | $1.00 | $.80 |
| Per Transaction | 7% | 6% Donations 4% | 4.8% |
This results in price differences that add up when multiplied by hundreds of thousands or registrations:
| Race Roster | RunSignup | |
| 1 X $10 | $2.69 | $1.60 |
| 2 X $10 | $5.38 | $2.20 |
| 1 X 50 | $5.49 | $4.00 |
| 2 X 50 | $10.98 | $7.00 |
| 1 X 100 | $8.98 | $7.00 |
| 2 X 100 | $17.99 | $13.00 |
In addition they reportedly charge $0.85 + 6% for donations (we charge a flat 4%). They also charge $1.95 for transfers (we do not charge for transfers).
This pricing change either means they are:
- Giving up on the market of customers who do not want to talk to salespeople
- Trying to create room for margins to share with timers like our Partner Program
- Satisfy Asics management with profits and margin
As we reported in March, Asics has also acquired Register Now is Australia, Runnet.jp in Japan, and Njuko in France. It looks like they are now onboarding Australia customers to Race Roster directly and are shutting down the Register Now system, which saves on resources. Njuko is still operating their own system. They did suffer a minor blow when LetsDoThis won the London Marathon from Njuko. Njuko embeds itself in websites, so their SimilarWeb numbers are small (188,000 with 27% in France), but we do think they get substantial registration volume, although at a far different price level with their service starting at just 0,20€ (about 21 cents US$) per registration. It will be interesting to see if Asics continues to support two (or three with Japan) technology platforms and pricing differentials this large.
Haku
Haku continues to spend aggressively on expansion. They have become the title sponsor for RunningUSA (we know this is expensive and do not have an interest in spending our money this way), as well as expanding internationally by sponsoring The Running Conference in the UK (they had started moving into Europe last year sponsoring other events).
Haku has a much different model than RunSignup with a focus on having employees go to races as their monthly newsletter seems to focus on rather than our technology focus. This is obviously a high cost model, but it seems to work well for some customers who are not comfortable with the timers and service providers.
LetsDoThis
Of course their big London Marathon win was the big news for them in the past 6 months. Anecdotally, we are seeing them less in the US these days, and their US website traffic numbers are down 29% from last year. We are not sure if they are expanding in Europe to satisfy their investors who poured $60 Million in 2022. But we are not seeing significant moves in the US.
Smaller Vendors
We continue to hold the opinion that smaller vendors will face an increasingly hard road ahead. The major platforms are very, very wide now with a lot of technology that is provided for very low cost. Eventually the technology differentiation between the larger vendors and the smaller vendors will erode personal relationships. Also, increasingly high infrastructure costs to maintain proper security levels may result in some bad news in the coming years. Within our business plans, we look for slow growth of market share, but as we have learned over the years, vendors go out of business very, very quickly. In situations like Race Partner, customers were left holding significant financial liabilities. In other situations, customers had to rush to find new vendors. Those changes will likely result in occasional shifts of market share over the next 5 years.
Summary
With the recovery of the endurance market in terms of # of events and # of participants per event coming back to normal levels, RunSignup, Race Roster and Haku seem to be on a good path forward to gaining market share and have healthy years. There may be other shifts of small and formerly large vendors in terms of market share.