
What is RaceInsights?
RaceInsights is like a custom Google Analytics designed specifically for endurance events. You can find your RaceInsights reports right on your race dashboard – dive in to learn how to get your data to work for you.
Overview Reports
Your Overview Report is the first set of graphs and numbers on your dashboard. The top graph shows you the pattern of conversions on your site (defaulting to the previous 7 days, but with customizable date ranges).
What Conversions Does RaceInsights Track?
Pageviews
Pageviews are every view of any page on your RunSignup website
Signups
A Signup is counted as a completed registration
Transactions
This is the total money paid to the race (including add-ons, donations, etc.)
Signup $
This category is the total money paid to the race for registrations only
Donation $
Donation $ is the money paid to the race for donations only

What Are Your Data Sources?
Referral Sources
Referral Sources are other sites (like Google, RunningInTheUSA.com, or your own non-RunSignup website)
Custom Sources
Custom Sources are sources you set up to track (see below)
Email Sources
Email Sources are all emails sent from the RunSignup system
Track Every Marketing Action with Custom Source Tracking
Custom source tracking lets you create a unique link to your race website that can be shared for a specific marketing action – allowing you to track the exact results of every action. For example, you can create unique links for each Facebook Ad, partner email blast, and ad in your local event calendar to see how much interest and action each item takes. Make it even easier to understand your ROI by adding your budget (where applicable).
Set up of Custom Source Tracking is easier than you think – learn how to create your custom links in seconds here.
Reports for comprehensive data on your event…
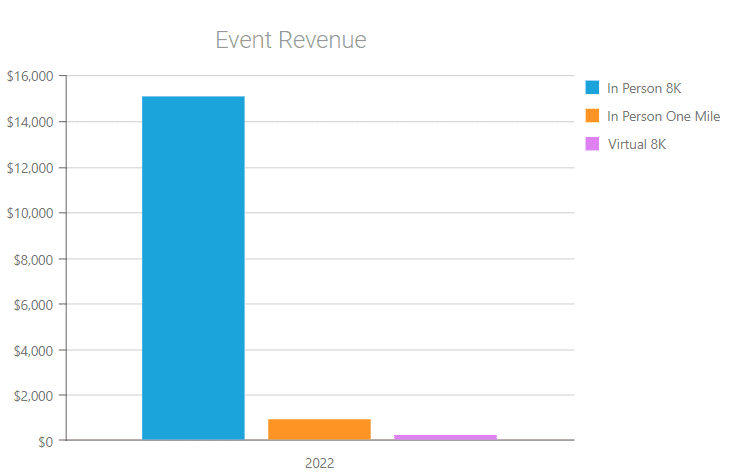
Transaction Reports
Transaction reports show you your year-over-year transactions to help you understand how your current transactions map onto previous patterns.
It’s not just transactions, though. From this page, you can also link to Participant Graphs that show you a similar year-over-year comparison of your registrations.
Promotion Reports
This set of reports breaks down the results of two key marketing efforts and provides the basis to improve participant loyalty by targeting previous participants.
The real power of this report is those buttons at the bottom, though.
The Repeat Participant Report shows you a downloadable list of all your repeat participants (and how many times they’ve returned) so you can make a custom reach-out to your most loyal fans. Want to target the ones who haven’t come back? There’s a checkbox at the top of the top of the report to show previous participants who haven’t yet joined this year.
The Loyalty Program lets you take action on your loyalty lists by linking you to the set up for a loyalty program. A loyalty program lets you open up registration to your previous participants before the general public – rewarding and incentivizing your fans.


Demographic Reports
Most of these reports are exactly what they sound like: a quick snapshot of the demographic profile of your event. Analyze data by:
- Age
- Gender
- City
- State
- Country
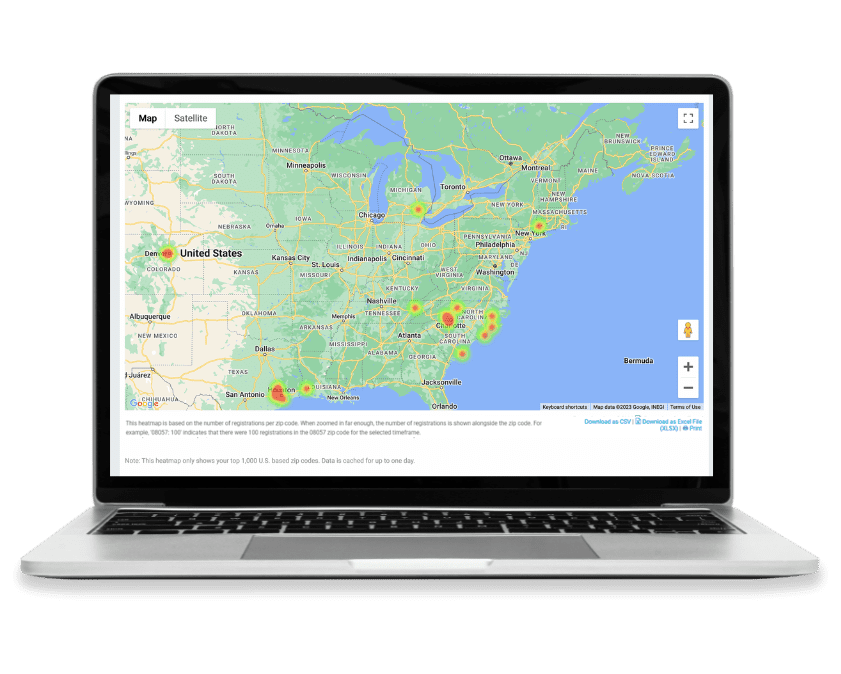
Heat Map
The Heat Map is the most actionable report amongst these. While it pulls up a fun map view of where all your participants originate, the true power is in the export at the bottom. From there, you can use the zip codes to learn more about where your participants originate – and make better decisions about what regions you want to target all your advertising money.
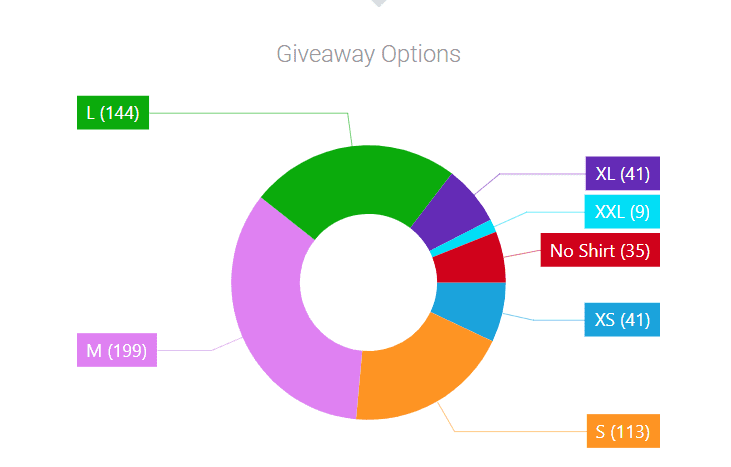
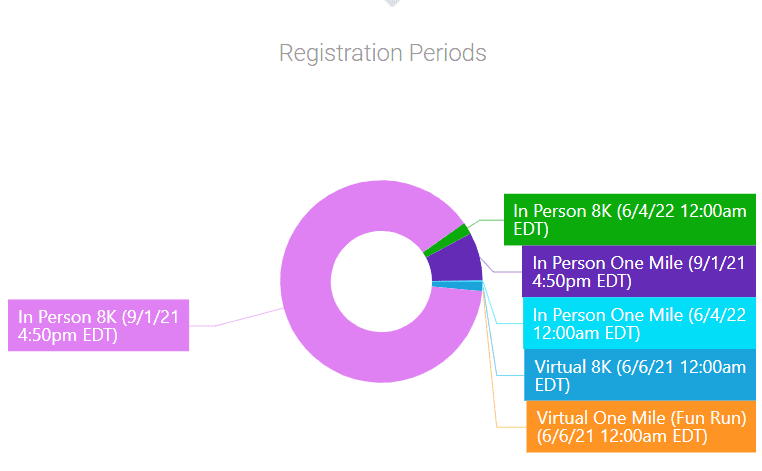
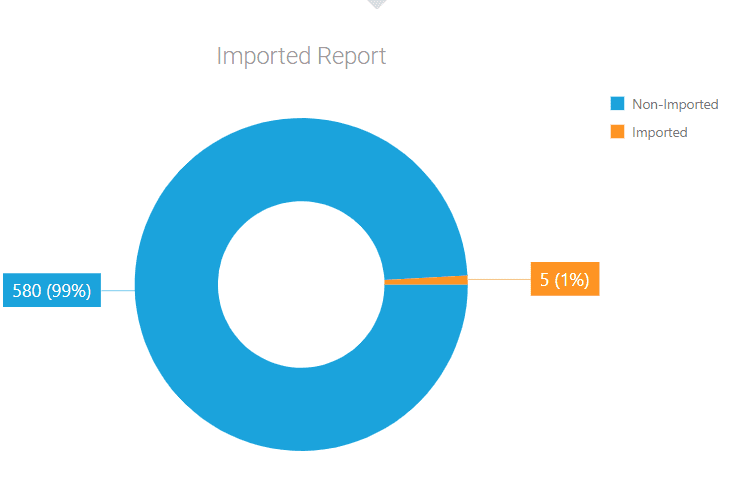
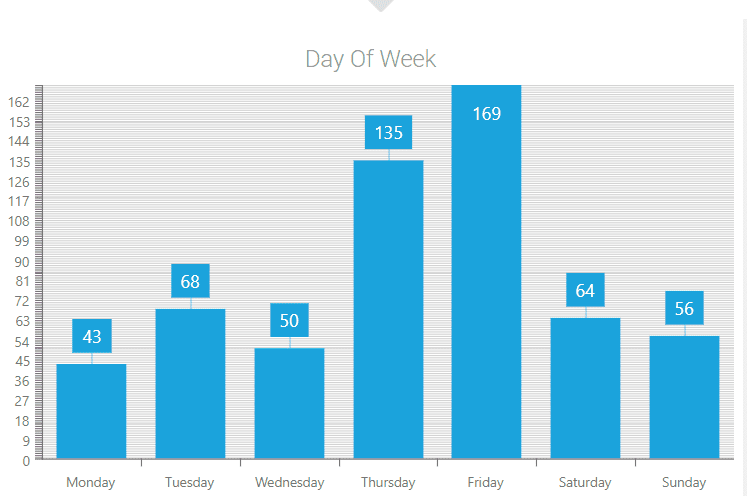
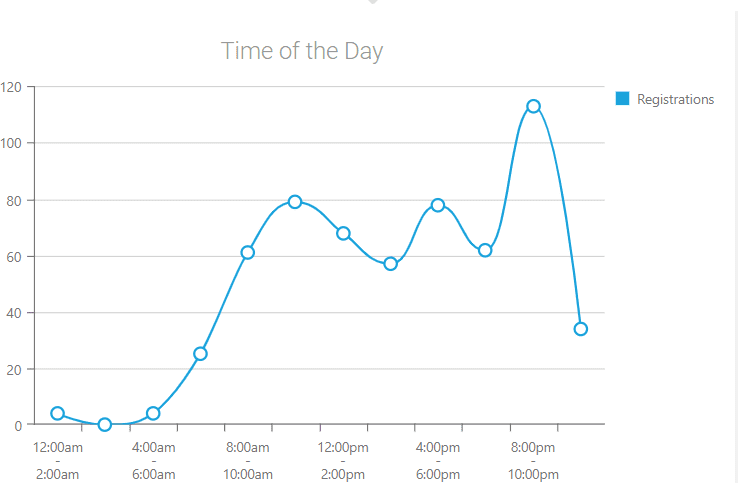
Registration Reports
The final set of reports on your dashboard are your Registration Reports. For many of these, there are downloadable, comprehensive versions of these reports to utilize. However, these versions give you a quick snapshot of your registration trends
Knowing your Data
Learn how to understand the reports within your RaceInsights and leverage the data collected.


Looking for More Reports?
All the Latest Blogs on RaceTrends
Flutie 5K for Autism Series
About the Flutie 5K for Autism The Doug Flutie Jr. Foundation for Autism has been serving the autism community for 27 years. Their flagship Flutie 5K for Autism in Natick, Massachusetts, is now in its 26th year, selling out with nearly 3,500…
Read More
How to Set Up a GA4 Account and Integrate with RunSignup
This blog is part of our Marketing Analytics series. It explains how to create a Google Analytics 4 account and integrate with your RunSignup events. It’s easy and free to set up GA4. To get started, all you need is a Google…
Read More
Marketing Analytics for Events
This week we did a series of 3 webinars on Marketing Analytics for events. Analytics help your event(s) make informed marketing decisions. There are two analytics tools that we covered in our webinar series: RaceInsights and Google Analytics 4. RaceInsights RaceInsights is…
Read More
Marketing Analytics: RaceInsights Reporting
Thanks to everyone who joined us for Part 1 of our Marketing Analytics Webinar Series focused on RaceInsights reporting. If you missed the webinar live, it’s not too late to catch up with the on-demand version. You can also find links to…
Read More
Single and Multi-Event Reporting for Google Analytics 4
In February, we announced support for Google Analytics 4. This is a significant improvement providing new reports, moving to an event based system and improved user tracking among other improvements. In July 2023, Google Analytics stopped processing data for its old universal…
Read More
Update to YoY Dashboard Transactions Graph
The year-over-year Transaction insights graph on your dashboard has a new update. Rather than displaying YoY transactions by calendar year, it now uses registration periods to display YoY reporting that is relevant and actionable for events. You can update the chart to…
Read More
Email V2 in RaceInsights Analytics
Email V2 stats now show in RaceInsights Analytics. This gives you even more insight into how your emails drive website views, registration numbers, and revenue. RunSignup email is free and you can send unlimited emails. However, it’s important to balance frequency and…
Read More
RunSignup’s RaceCRM and RaceInsights Provide Powerful New Source Tracking
Race Directors Can Now Track Registration Source by Individual Moorestown, NJ – RunSignup, the leading technology provider for endurance events in the US, has integrated data from their internal RaceInsights tracker into the RaceCRM to provide race directors with detailed source information…
Read More
CRM RaceInsights Source Tracking
We have integrated the power of RaceInsights with the power of the RunSignup purpose-built CRM with source tracking. This gives races the ability to understand the source of a registration on a per person basis, as well as market to specific channels…
Read More
Custom Source Tracking Now on Dashboard
We have added the Custom Source Tracking to be visible right on your dashboard. This enables you to track specific promotional activities like Facebook posts and ads, partner websites, newsletter, expo booths, etc. to see what is having a good return. This is shown…
Read MoreRunSignup, Facebook, or SEO: What’s Most Effective for Your Race Marketing?
RaceInsights is helping races understand where their participants are coming from. It is also helping us see an overall aggregate picture across all races that use RunSignup. This allows us to see what is working across all races. Obviously, the most important source…
Read MoreCustom Source Tracking for RaceInsights
We are introducing a major new feature for RaceInsights – custom source tracking. This gives races the ability to track the ROI on specific campaigns – such as Facebook ads, race promotions on other sponsor or running store websites, or emails sent…
Read More